This web page explains all the data available from the GEONS schools. A tutorial on the general magnetometer observations and the x,y,z plots is available on the left as a PowerPoint and a webpage to introduce the data to those who are new to the data. These tutorial pages are also intended for use with students in the classroom and introduces the x,y,z data one step at a time. For lessons using the data, please visit our "In the Classroom" page.
A note on Universal Time: Universal Time is the time kept in the time zone centered on Greenwich, England (longitude zero). Universal Time does not participate in daylight savings time, so there is no springing forward or falling back one hour during the year. UT times are given in terms of a 24-hour clock. Thus, 14:42 is 2:42 p.m., and 21:17 is 9:17 p.m. As an example of how to compare times in different time zones to universal time, in the winter when it is 6:00 am in Oregon, it is 7:00 am in Montana, 9:00 am in Pennsylvania, and 14:00 Universal Time.
For more on Universal Time, and other time systems, visit the Time Service Department of the United States Naval Observatory. They are the official time keepers for the United States.
For classroom lessons on time zones and Universal Time, see our THEMIS "Space Weather" teacher's guide. Download an Acrobat version here - (
PDF Format - 0.9MB) or visit the THEMIS classroom page to learn more about it.
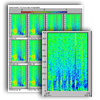 24-Hour and 30-Minute Spectrographs Time is on the x-axis in Universal Time. The last 24-hour of data is shown in the plots on the left top image. The last 30-minutes of data is shown in the plots on the left bottom image. Waves in Earth's magnetic field have a frequency and that is given on the y-axis. The color represents the amount of power in the waves with red indicating a lot of power and blue very little power. A green-yellow solid background is noise in the magnetometer. Red often indicates interesting space weather, but can also indicate cars passing by the school or other moving metal nearby the magnetometer. The wave power is obtained from the waves in the X panel of the line plot every 10 minutes for the 24-hour spectrograms and every 1 minute for the 30-hour spectrograms (see XYZ plot). Each spectrogram plot represents magnetic wave data observed at a particular school around the country, as indicated by their school name.
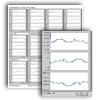 24-Hour and 30-Minute XYZ Plots Time is on the x-axis in Universal Time. The last 24-hour of data is shown in the plots on the left top image. The last 30-minutes of data is shown in the plots on the left bottom image. The y-axis represents the magnetitude of the magnetic field in units of nanotesla. There are three panels representing Earth's magnetic field: 1) the first panel shows the magnetic field strength in the X-direction: the direction toward Earth's magnetic pole in the north, 2) the second panel shows the magnetic field strength in the Y-direction: eastern direction perpendicular to the X-direction, and 3) the third panel shows the magnetic field strength in the Z-direction: downward direction. Each XYZ plot represents magnetic field data observed at a particular school around the country, as indicated by their school name. Because the magnetic field strength is largest in the Z panels, this means that Earth's magnetic field in the U.S. is mostly downward. The next largest magnetic field strength is in the X panels, indicating that Earth's magnetic field in the U.S. points strongly northward towards' Earth's magnetic pole. Waves in Earth's magnetic field can be seen as wiggly lines on these plot.
24-Hour and 30-Minute HDB Plots Time is on the x-axis in Universal Time. The last 24-hour of data is shown in the plots on the left top image. The last 30-minutes of data is shown in the plots on the left bottom image. There are three panels representing Earth's magnetic field: 1) the first panel shows the magnetic field strength in units of nanotesla in the H-direction: the direction horizontal to Earth's surface like the way in which a typical compass points, 2) the second panel shows the angle (D) from the X-direction (close to magnetic north) where the magnetic field is pointing, and 3) the third panel shows the total magnetic field strength at this location. Each HDB plot represents magnetic field data observed at a particular school around the country, as indicated by their school name. Because the angle is so small in the D panel, this means that the horizontal directional changes in Earth's magnetic field due to space weather or electrical currents nearby are very small compared with Earth's total magnetic field. Waves in Earth's magnetic field can be seen as wiggly lines on these plot.
| Spectrographs | XYZ Plots | HDB Plots |
|---|---|---|
| View 24-Hour Spectrographs | View 24-Hour XYZ Plots | View 24-Hour HDB Plots |
| View 30-Minute Spectrographs | View 30-Minute XYZ Plots | View 30-Minute HDB Plots |
| School | Code | 24-Hour Plots | 30-Minute Plots |
|---|---|---|---|
| Kiana, AK | KIAN | No Data |
No Data |
| McGrath, AK | MCGR | No Data |
No Data |
| Petersburg, AK | PTRS | No Data |
No Data |
| Carson City, NV | CCNV | No Data |
No Data |
| Ukiah, OR | UKIA | No Data |
No Data |
| Hot Springs, MT | HOTS | No Data |
No Data |
| Pine Ridge, SD | PINE | No Data |
No Data |
| Prince George, BC | PGEO | No Data |
No Data |
| Shawano, WI | SWNO | No Data |
No Data |
| Remus, MI | RMUS | No Data |
No Data |
| Brimley, MI | BMLS | No Data |
No Data |
| Loysburg, PA | LOYS | No Data |
No Data |
| Derby, VT | DRBY | No Data |
No Data |
Magnetometer data plots (XYZ, HDB, and Spectrogram) from the past are available at the archive data page.
Magnetometer data ASCII files (XYZ) from the past are available on the THEMIS E/PO Magnetometer ASCII Data Retrieval page.