
Sonification Programs
Jump to software for download
Jump to full source version of Max/MSP software for developers
Why do we care about Sonification?
There are many reasons why data sonification is useful and interesting. Three such reasons are: 1) to create sounds that people can listen to regarding safety data so that when a situation becomes unsafe, the data changes and people hear this change and know to take action, 2) to help people understand data since people learn in many different ways, and 3) to help the blind to learn about science data or to be able do their own scientific research.
Sonification for Beginners:
Data is the outcome of a set of measurements or observations. After scientists place instruments on a spacecraft that flies out to space, these instruments can take measurements of things in space, such as charged particles. These measurements are recorded and sent to Earth. This information is data that can help scientists understand more about the space enviornment, such as the solar wind or regions of Earth's outer most magnetic field (magnetosphere).
Sonification is the act of representing data as sound. An example of sonification is using a wind chime to convert wind speed to music. The higher the wind speed is, the more notes are played in one second. We often use the mathematical verb "to map" to describe converting data to sound: "We mapped the wind speed to the number of notes played in one second by the wind chime."
Different types of sonification can be categorized in three ways (J. Keller's definitions, 2003, private communication):
Iconic Sonification -
This type of sonification is when someone maps data to sounds that are associated with certain phenomena. For example, if we gathered weather data, such as cloud cover, temperature, and humidity, to calculate the probability of rain tomorrow, then using the sound of rain to indicate when there is a high probability of rain would be an iconic sonification.
Direct Conversion Sonification -
This type of sonification is when someone maps data to sound to listen for patterns that are represented in the data. For example, space scientists map data of waves made up of magnetic and electric fields called electromagnetic waves to sound waves. This direct conversion sonification can be as simple as taking the frequencies of the waves and making sound waves with the same frequencies, which is most useful as long as the frequencies are at pitches that our ears can hear. Earth's whistler wave is such an electromagnetic wave that scientists have been sonifying for over 30 years. Other similar types of space wave data has been sonified from as early as the 1890's.
Musical Sonification -
This type of sonification is when someone maps data to sound in a musical way. For example, we have created a computer software program that will convert data of very fast particles that have come from the and are captured by an instrument on one of 2 satellites in space, called Helios 1 and Helios 2, to bell-like sounds. Several musicians have used musical sonfication of space data to create quartet or orchestra music pieces.
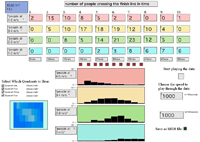
To listen to examples of some of these types of sonifications, visit the examples page or the links page. To create your own music from data, download one of our three software programs and the appropriate data. The beginning software program allows the user to type in data collected by the user, to visualize it on a bar graph, and to listen to it using sounds. The different numbers entered determine a pitch, lower values are played as lower pitches and higher values are played as higher pitches. Multiple data sets or three dimensional data sets can be listened to, which can train a user to understand the STEREO particle data.
Beginning Application
 Downloads:
Windows (2.52 MB, zip)
Macintosh (1.84 KB, zip)
System Requirements
There are two versions of the program that will run on either a Macintosh running OSX 10.3 or a PC running Windows XP/2000. The program runs best with a minimum memory of 384 MB RAM and processor speed of 600 MHz.
Instructions
Advanced Sonification
STEREO Spectro
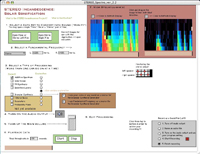 We have developed a software program to sonify solar wind data from a three-dimensional color plot of the data. David Bithell and Roberto Morales created this software with support and consulting of Laura Peticolas, Nahide Craig, Janet Luhmann, and Stuart Bale. In this program there are five different ways to sonify the data with the ability to change the fundamental frequency used in each bin. Currently we have made available four plots of ion composition energy flux data for Helium (He), Carbon (C), Magnesium (Mg), and Iron (Fe) from NASA’s Advance Composition Explorer (ACE) satellite. You can use your own data as long as there are 8 bins in the y direction and the image you are using is only of the plotted data with the number of pixels in the image equal to the number of bins of data in the x-y plot. For example, if you have data with 8 energies and 20 time samples, then the data should be plotted with no margins, no x or y labels, and as a 20x8 pixel image.
To listen to an example of the sounds we made with this program, please visit our Examples page.
Downloads:
Application for Windows (2.79 MB, zip)
Image Data Files for Windows (18.4 KB, zip)
Application for Mac (2.53 MB, zip)
Image Data Files for Mac (18.0 KB, .sit)
System Requirements
There are two versions of the program that will run on either a Macintosh running OSX 10.3 or a PC running Windows XP/2000. The program runs best with a minimum memory of 512 MB RAM and processor speed of 1 GHz but it will run with 318 MB RAM and 600 MHz.
Instructions
Incandescence 1.1
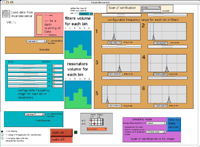 This application uses the Solar Energetic Particle (SEP) dataset for control of several sonic realizations. The following methods are used:
- Control of resonant filters which operate on white noise
- Control of peak frequency for parametric EQ filter
- Tranlation to an algorithmic piano composition using 6 axes:
- How long each event lasts
- Rate of notes per second
- Pitch distance (intervals) between notes
- Dynamic range (i.e. loudness) range of notes
- Octave range for first voice
- Octave range for the second voice
Please visit our Examples page to listen to a sample of Roberto Morales-Manzanares' "Turning Point" symphony, which he composed using inspiration from Helios satellite solar wind particle data while creating this software program.
Downloads:
Application for Windows (2.60 MB, .zip)
Helios 1 SEP Data for Windows (3.27 MB, .zip)
Helios 2 SEP Data for Windows (864 KB, .zip)
Application for Mac (1.41 MB, .zip)
Helios 1 SEP Data for Mac (3.27 MB, .sit)
Helios 2 SEP Data for Mac (864 KB, .sit)
Instructions (173 KB, .pdf)
Max/MSP Software
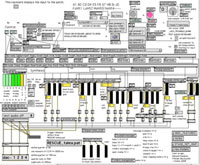
Full source version of the most recent Max/MSP software for Max/MSP developers.
 For Macintosh (25.8 MB, .zip)