
Sonification Examples - Solar Wind
ACE Flux Data Sonification
For this example, we used the Iron and Helium flux data from the ACE mission. The data are courtesy of the ACE spacecraft investigators. The composition data has eight energy bins and is collected over a period of about a month.
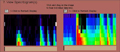 We use solar wind Iron and Helium fluxes at different energies collected from April 14, 1998 to May 10, 1998. On the left image is the Iron flux with time as the x-axis and energy on the y-axis. The right image shows the Helium flux with the same x- and y-coordinates. In this spectrograph image, the red color represents highest flux and blue is lowest. The red intervals thus represent major SEP "events" from either solar activity or corotating interplanetary shocks. The RGB value of each color in the graph determines the pitch played by the program. Can you hear the increase in particle flux pass by the satellite?
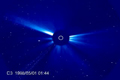 We combined these sounds with a SOHO LASCO movie showing a month of the ever changing Solar Corona at the same time when the ACE satellite was measuring Iron and Helium fluxes.
Helios Flux Data Sonifications
The following sounds were generated at the Space Sciences Laboratory at the University of California in Berkeley using solar wind particle data from two different satellite missions, Helios 1 and 2 and the Advanced Composition Explorer (ACE).
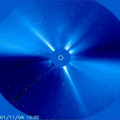 View a movie of a Coronal Mass Ejection taken by the LASCO instrument of the SOHO satellite. In this movie, you can both hear and see the SEP particle data arriving at the spacecraft. We used the Helios satellite data to provide the sound for the movie.
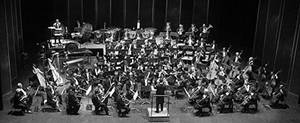 Listen to a short segment of “Turning Point,” a symphony piece written by Roberto Morales Manzanares. Mr. Morales Manzanares created the software program for musicians for the STEREO sounds project. This program is available for free on our applications page. Make your own music using the Helios data and this software program.
For this example, we used the Solar Energetic Particles (SEP) data from the Helios mission. The data are courtesy of the Helios spacecraft investigators and Don Reames at the Goddard Space Flight Center (GSFC). The SEP data were collected in six energy bins over several years. Both the spectrograms and sounds are sorted by Carrington Rotation**
To translate this SEP data to sound, each bin at each time is assigned a musical tone. The pitch of the tone remains constant, but the amplitude varies depending on the value. Thus, certain notes within the chord are louder than others, reflecting the relative flux of the energy bins. By utilizing the data from both satellites of the Helios mission, the resulting sounds have a "stereo" effect. Click on the spectrograph* below to access sounds from several Carrington rotations. Use headphones to fully appreciate the stereo effect
 |
Click on the images on the left to download the sound files. In the spectrograph, the red color represents highest flux and blue is lowest. The red intervals thus represent major SEP "events" from either solar activity or correlaing interplanetary shocks. The two Helios spacecraft detect different particles, some of which may come from a very large disturbance that makes fluxes at both locations. The two detections can be used to tell something about the size and direction of the source. |
 |
|
 |
|
 |
|
 |