|
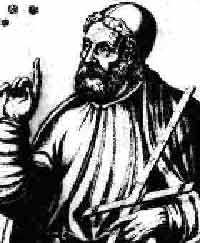
To learn more about Ptolemy, click here
|
So you've come to Ptolemy for a graphing activity. Who am I? Well, I'm an ancient
Greek astronomer. One of my most important works of astronomy was compiling an encyclopedia
of the heavens. In it I used centuries of Babylonian observations to map the stars
and the planets, which I thought revolved around the Earth. Your graphs are not the
same as the ones I used, but I think I can help you with a modern
graphing activity.
Astronomers use graphs to sort information about the colors and wavelengths of light
that they collect with their telescopes. In this activity we will be sorting colors
too. This time, you will be sorting different
colored objects of your choice. Pull
down the menu in this box by holding the mouse button down over the arrow, then
move the mouse to select something to sort:
Good choice! Do you see the group of
and the graph that
I made for you?
Just for fun, try to guess quickly how
many there are of each color without counting them, and write your guesses down.
Now take a look at the colors on the graph. Drag each of your
onto the graph so
that it is right above its color. Do this until all of your ALIENS are on the graph.
When you're done, you should be able to tell easily how many there are of each color. How close were your guesses?
Make a picture of your graph in your
notebook, and don't forget to draw the x-axis and y-axis (the axes). Write down
how many
there
are of each color.
If it's too hard to draw them, you can just draw a colored
square for each one in its place on the graph.
Congratulations! You have completed your graph. How
do astronomers use graphs like this? Go on to your next guide to find out
and make your own
graph.
|