Welcome to Level Three
|
|
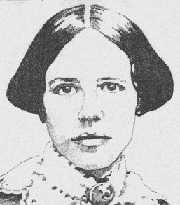
Good Day, I'm Maria Mitchell, an American astronomer. In 1847, I discovered a comet. I was the first professor of astronomy at Vassar College, and in 1848 I became the first woman to be elected to the American Academy of Arts and Sciences. I have also worked hard towards creating equal educational opportunities for women, some of whom will be your guides today.
By plotting the intensity of the colors from a light source on a histogram, scientists create a picture from which they can "read" information about the entire spectrum of a light source--all the colors at once.
Our color cards can help us get started. We can put the different colors on the x-axis of a graph and the intensity shown in our color cards on the y-axis, to make a histogram of the sun's spectrum. The histogram for sunlight looks like this:
The color cards show intensity of one color by the number and shade of color. The histogram gives the intensity of each color as the height of that color's bar on the graph. Each bar has the same height as the intensity number on the color card.
Now I'd like you to examine the histograms of these different sources of light. You'll see I've added some new sources: several elements. Elements are substances like hydrogen, helium, and iron that are made entirely of a single kind of atom. A scientist named William Wollaston showed in the 1800's that when they are heated, each chemical element glows with a spectrum of its own distinctive colors. We'll look at the elements helium, hydrogen, and iron, because they occur in many stars.
To Do: Click on any of the sources above and you will see a histogram of this source's light in a second window. You may need to move or scroll the window to keep both the sunlight histogram and the new one on the screen. Compare the new histogram to the graph of sunlight. When you are ready to go on to another source, look for the linked icons at the bottom of the new source's page in the new window.
Observe and Record: Keep clicking to look at the histogram for each of the sources of light.
- Draw or write down what you observe about each graph in your notebook.
- Also, notice the histograms compare to each other. Write down what makes the graphs for different sources different.
- Can you describe a basic difference between the elements and our more familiar sources?


