Rainbows, Prisms, & Spectra: Page 2.4

|
|
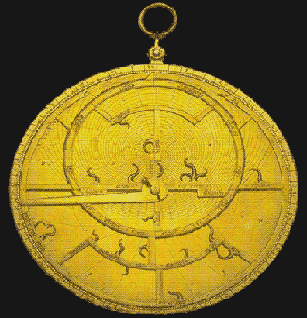
Learn more about astrolabes. |
Greetings, seeker of knowledge. I am known as Abd al-Rahman. I am an Arab astronomer, and I lived in the early middle ages. In the West you call me Azophi. I used astrolabes like the one you see here to study the positions of stars and planets. I made some of the first observations about the magnitudes of stars. When people say that I'm intense, I take it as a compliment, for I think the intensity, or brightness of light is highly interesting.
From Dr. Young, you learned about the different wavelengths of light: how different colors are really different wavelengths. But what about intensity? I'm here to tell you that intensity matters just as much! In fact, if you can measure the intensity for each color (wavelength) of light coming from a source, you will find, if you continue to study, that you know quite a lot about that source.
To Do: (This is easy!) We'll sometimes use color cards like the one here to show the intensity (brightness) of different colors of light. Choose a color from the menu and adjust its intensity by clicking on the up arrow and down arrows. Try adjusting the intensity of a number of colors. The cards show intensity in two ways: as a color and as a number.
The sun, a candle, and a light bulb are all sources of light. Each source of light will produce a spectrum as its light is refracted through a prism. However, the spectra made by different light sources are quite different.
Questions:
- Think of some examples of light sources that have different colors, and write them down. Remember, a source must make light of its own.
- How might the spectra for these sources look different from one another? Write or draw your own ideas before going on.
Continue: For each of the three light sources below I've made a picture to represent the spectrum. I have used color cards to show the intensity of six different wavelengths (colors of light). Click on each source, and pay attention to the intensity shown by the color cards. Notice how they are different. The colors of each spectrum are always in wavelength order, with red at one end of the spectrum and violet at the other.
Observe and Record: Write your observations of these sources in your notebook and answer these questions:
- How would you compare the light from each of these sources?
- How is each source different?
- Would an astronomer be interested in sunlight? Why?
Continue: Go to the next level of astronomy skills to learn how astronomers represent spectra of different light sources with graphs, and why this is very useful.


