Histograms of Spectra: Page 3.2
|
|
Hello, pleased to meet you. My name is Caroline Lucretia Herschel. I am a German astronomer who moved to England in 1787 to help my brother, William, the royal astronomer to King George III. My brother and I made a complete map of all the stars we could see in the heavens. Later I made a map of what we called "nebulae" that was considered quite complete in the 1820's. Of course, astronomers of your time can see many more stars with those wonderful new instruments like the Hubble Space Telescope.
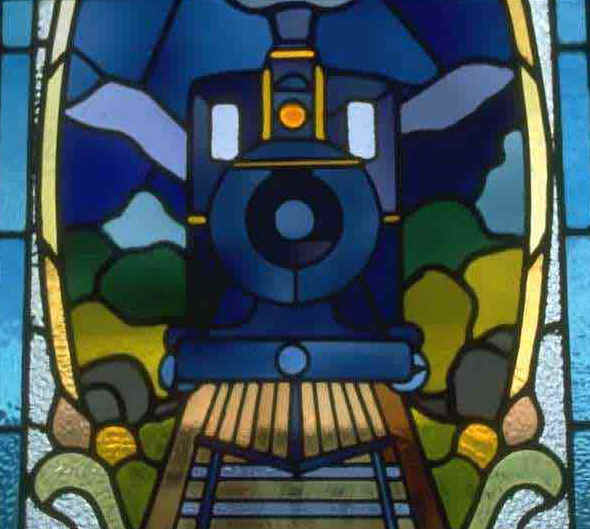
Today I'm going to show you something new about how astronomers use spectra. Sometimes, we want to look at only a part of a spectrum, so we use a filter to block the other colors.Have you ever seen a stained glass window? Well the different colors of glass act as filters on the sunlight, letting only some wavelengths (colors) through. We say that they act as a filter by transmitting some wavelengths, and reflecting or absorbing the others.
Sometimes, light from a distant star passes through a cloud of gas or dust in space which acts like a filter by absorbing some of the light. In both cases, something subtracts certain parts of the light from the source.
To Do: Take a look at the histograms for blue, green, and amber (dark yellow) glass by clicking the box on the left. The light shining through each color of glass is from a very bright incandescent light bulb.
Observe and Record: Figure out how much of the light's spectrum each color of glass subtracts at each of our six spectrum wavelengths. Click on the light bulb picture if you need to look at the histogram of the source.
Questions:
- Can you express the transmission of the glass for each wavelength as a fraction or percentage? Write these down; you'll need them.
- Are there any colors that are completely taken out?
- What do we know about what the filter does to those colors?
- What if the source had a higher intensity in those colors? What if it was lower?
Write down what you think, even if you are not sure.
- What histogram would you get if you looked at a fluorescent light through each color of glass? What about sunlight?
Here's How to Figure it Out:

- Click on these pictures to see the source spectra.
- Choose one, and use your transmission fractions to find your best answers for the new "input" spectrum.
- Show how you got them in your notebook.
- Sketch the graphs for the glass spectrum with the new light source.
Next: Now you are familiar with sources that emit light, and with filters that remove light. Your next task will be to do something astronomers must do. Can you identify what light source a spectrum is from, just by looking at its histogram?