X-ray Candles:Solar Flares on Your Birthday
X-ray Candles: Solar Flares on Your Birthday
Solar Flares:
The Sun is the nearest star to Earth and our close proximity allows us to study it in great detail. Observations reveal that the Sun is extremely dynamic, with changes taking place on many timescales. In this activity we will investigate one of the fastest and most energetic events on the Sun, solar flares.
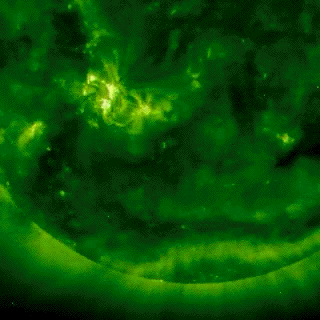
During a flare the Sun releases a large amount of energy in a short period of time. Scientists observe solar flares in many different wavelengths, from low-energy radio waves to high-energy gamma rays. The RHESSI satellite will make much sharper pictures of solar flares in high-energy x-rays and gamma rays than any satellite to date. When you click on the image to the right you will see a movie which shows several solar flares seen in extreme ultraviolet light by the SOHO satellite. The flares are the flashes which occur in the more active (or brighter) region of the Sun. |
 |
GOES X-ray Data
This activity we uses x-ray flare data from GOES satellite, a Geostationary Operational Environmental Satellite, since
RHESSI has not yet collected data. GOES satellites primarily monitor environmental conditions on the Earth, but there is an x-ray monitor on board which records x-ray emission from the Sun.
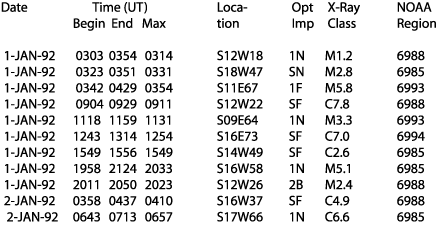
The image below is a sample of some GOES data. Just like scientists do, we will be looking over tables and tables of data to learn something about the Sun. Luckily, in this activity we will only need the information in the Date and X-ray class columns.

In the data columns the first column is the Date the solar x-ray flare was recorded. The X-ray class is a scheme used by scientists to classify how energetic the solar flare was, it is explained in detail below. Although this lesson will not use data from the other columns, you might be interested to know what they are, as described immediately below. If not, move on to the X-ray Flare Classification section further on.
Additional Data Columns
In the data above the Time columns report when the flare occurred (in Universal Time, or Greenwich Mean Time). The individual columns are when the flare frist began, when it ended, and when it was at its maximum. The Location column indicates the location of the flare in latitude and longitude on the Sun. The Opt Imp column stands for optical importance. It is a measure of how big and bright the flare was in optical (H-alpha) light. The first digit in the optical importance is either the letter S or a number 1 - 4. This is a measure of the optical size of the flare with S being the smallest (Subflare), and 4 being the largest. The second digit in the optical importance column indicates the optical brightness of the flare and is either F(faint), N(normal) or B(brilliant). The X-ray Class column is discribed below. The NOAA Region column indicates which NOAA active region the flare was associated with. The NOAA numbers all active regions which appear on the Sun.
 | X-ray Flare Classification |
Scientists use a series of letters and numbers to classify the energy level of an x-ray flare. The letters used are A, B, C, M and X, with A being the weakest and X being the strongest. For this activity we will only use the x-ray classification letter. If you are interested in the meaning of the number which follows read on, otherwise you are ready to start the flare activity.
X-ray Flare Intensity
You'll notice the flare classification letter is followed by a number which tells us the specific intensity of the flare. X-ray flare intensity is measured in units of power per area or Watts per meters squared. Each letter (A, B, C, M or X) represents a certain numeric value and the numbers following the letter in the flare classification multiply that value. The numeric values of the letter classes are listed below,
A = 1.0x10⁻⁸ (W m-2)
B = 1.0x10⁻⁷ (W m-2)
C = 1.0x10⁻⁶ (W m-2)
M = 1.0x10⁻⁵ (W m-2)
X = 1.0x10⁻⁴ (W m-2)
To determine the exact intensity of the flare you multiply the number in the x-ray classification of that flare by the value of its class listed above. For example, a C5.9 flare would have an intensity of 5.9x10⁻⁶ W m-2.


