X-ray Candles: Solar Flares on Your Birthday
Student Activity
Overview:
Students will "discover" the solar cycle through an investigation of solar
x-ray flares. Using GOES x-ray data, they will record the total number of
flares in their birth month over 11 years and will compute the percentage
of high class flares which occur for each year. Students will graph their
findings to help them identify the long term pattern of flare activity on
the Sun. If you have not already done so, please visit the previous page for an introduction to solar flares.
This activity has been featured as part of NASA Connect's Having a Solar Blast program for educators.
The associated activity guide will be helpful in completing the lesson.
Instructions:
- Break-up into groups, where each group is composed of people
born in the same month.
If there is a month for which no one has a birthday, or if you are
doing this activity on your own, we have prepared a flare summary list that can be used to fill
in data for the months where you have no one to perform the activity. The flare
summary list may also be used in place of the full data files to shorten this activity.
- The data below are organized by month. Print out the pdf data file
for each month, and distribute them to the appropriate groups. Or,
arrange to have each group working on the computer, looking at the data
from there.
Data
The following data files have been reduced to make this activity more
manageable. To do this reduction we have provided the sum of flares of the same type for each day. We have
also neglected the few flares which were not able to be classified. The instructions below explain what to do with the data.
- Remember, if you are working with a small number of students, or
individually, print only the data from the months for which you have
someone with a birthday. Refer to the Flare Summary page at the end of the lesson to fill
in the totals for the months you are missing.
- Due the the large quantity, the data have been reduced for you. Each
data line lists the number of flares which occurred that day, separated by
flare type. Solar satellites can only record flares which are above the
normal x-ray level of the Sun. You'll notice that there are very few A
type flares recorded, this is because they are usually below the normal level.
- Count the total number of flares that occurred in your birth month for
each year. To do this, first add together the numbers across the row for each
day, record that number in the last column. Once you have added together
the number of flares for each day, add together all the numbers in the last
column to get the total number of flares in your birth month for that
year. Fill this number in the box at the bottom of the page.
- Once you have recorded the total number of flares in your birth month
for each year, count and record the total number of M class flares in your
birth month for each year. You can do this by adding together all the
numbers in the M class column. Record the answer in the box at the bottom.
We single out M class flares because they are always strong enough to show
up above the normal x-ray level of the Sun. X class flare are the most
energetic, and are also always strong enough to be visible, but they do
not occur very often and therefore it would not be terribly interesting to
count them.
- Once everyone has recorded the total number of flares, and the total
number of M class flares for their birth month in each year collect all
that information to obtain the total number of flares for all months added together in
each year, and the number of M class flares for all months added together in each
year.
- At this point everyone should know the total flare count, and the
total M class flare count for each year. If you are familiar with the
one page summary version of this
lesson , please do not worry if the final flare counts from this activity
come out slightly different than the ones posted there. The process of data
reduction, or counting errors, introduce small, and insignificant differences.
The general results will be the same.
- Next, compute the percentage of M
class flares for each year. This is done be dividing the number of M class
flares by the total number of flares and multiplying by 100. Record the
percentage of M class flares for each year.
- Plot the percentage of M class flares versus year. To do this make a
plot with the year along the horizontal axis and the percentage of M class
flares along the vertical axis. You can also plot the number of M class
flares versus year, or the number of total flares versus year, in this same
way.
Follow Up:
What do you notice from your graph? You should see that the percentage of
high-energy flares from the Sun is not constant in time. This is also true
of the total number of flares, and the total number of M class flares. You should see a minimum percentage of M class flares in 1996 and a higher percentage near the year 2000. If you were to extend the graph for a much longer period of time, you would discover that the rise and fall occurs in a very regular cycle that repeats itself every eleven years.
Scientists also see this eleven-year activity pattern in the number of sunspots
on the Sun, and solar flares are known to originate in regions where there
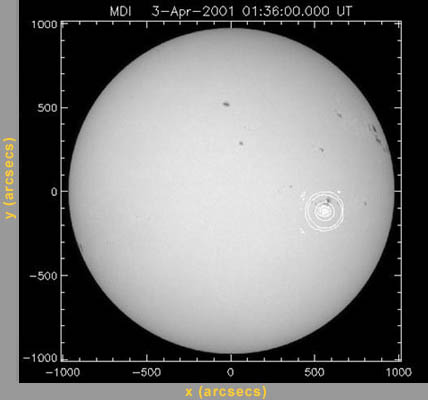
are sunspots. The image below shows a simulated RHESSI flare (white circles) superimposed on
an image of the Sun. You can see the expected correlation, that solar
flares occur in regions over sunspots. In general, the Sun goes through a regular activity cycle with eleven years from one maximum (or minimum) to the next. The last solar maximum occurred in the year 2000, and the last solar minimum was in 1996. This pattern should be visible in your graph. Can you predict when the next solar maximum, or solar minimum, will be?
To learn more about the Sun's 11 year cycle, visit the links below.
Sunspots and the Solar Cycle
The Sunspot
Cycle
Sunspot Cycle
Predictions
The
complete GOES X-ray flare data files are available on-line (at the data page click on the link labeled xray1975,
for example, to see the data from 1975). The page that explains the format of these particular data files is available here.
Lesson designed and developed by Michelle B. Larson
Please send questions or comments to michelle@krl.caltech.edu