|
Session 4: Solar Flares
Session Summary
Activity 1 - Magnetic Fields on the Surface of the Sun
-
Students map the magnetic field around two opposing magnetic poles. They also make predictions of fields for other configurations and draw them.
-
Students are given a worksheet with a drawing of sunspots on the surface of the Sun, which is labeled North and South. They are asked to draw what they think the magnetic field looks like above the surface.
-
The teacher gives a lecture about magnetic fields on the surface of the Sun, explaining how they cause sunspots and form loops in the Sun’s atmosphere. (Online version includes a PowerPoint presentation with pictures and movies, for those that can make use of it. The printed guide includes lecture overheads and notes for each slide.)
Activity 2 – Magnetic Energy and the Cause of Solar Flares
-
Students witness demonstrations that magnetic fields can store potential energy and then release it as kinetic energy. (Jumping coils, and galvanometer experiments from Exploring Magnetism).
-
Students are assigned to read an essay about how magnetic fields on the Sun evolve, store energy, and then release them in Solar Flares (there is a focus on conservation of energy, and energy comparisons). Students complete a concept map to assess their understanding of the reading.
Activity 3 – Measuring the Speed of an Ejected Blob of Plasma
-
Students examine image data from the RHESSI satellite of a Solar Flare that expels a blob of plasma, which eventually becomes part of a Coronal Mass Ejection (April 15, 2002, ~23:10 UT, # 2041509). They will predict the shape of the magnetic field in the flare region.
-
Students measure the speed of the blob by measuring the change in its position in a timed sequence of RHESSI images, and then graphing the results.
-
Advanced students may also estimate the energy of the blob by first estimating a mass for it, using its size and the density of plasma in coronal loops.
-
Advanced students can also estimate the magnetic field strength that produced the solar flare and CME using the equation for magnetic energy density and a couple additional measurements.
Activity 4 – Science Conference
- Students submit abstracts of their findings for a presentation at a mock science conference about Solar Flare # 2041509.
- After the teacher selects which abstracts will be used for posters and which will be for oral presentations, the students work in their science teams to create and present their posters and talks at a mock science conference
Science Topics
- Force and Motion
- Magnetism
- Electromagnetism
- Conservation of Energy
- Space Science: The Sun
National Science Education Standards (Grades 5-8)
- Science as Inquiry
- Abilities necessary to do scientific inquiry
- Understandings about scientific inquir
- Physical Science
- Properties and changes of properties in matter
- Motions and forces
- Transfer of energy
- Earth and Space Science
- Structure of the Earth system
- Earth's history
- Earth in the Solar System
- Science and Technology
- Abilities of technological design
- Understandings about science and technology
- History and Nature of Science
- Science as a human endeavor
- Nature of science
- History of science
National Science Education Standards (Grades 9-12)
- Science as Inquiry
- Abilities necessary to do scientific inquiry
- Understandings about scientific inquiry
- Physical Science
- Motions and forces
- Conservation of energy and increase in disorder
- Interactions of energy and matter
- Earth and Space Science
- Origin and Evolution of the Earth system
- Origin and evolution of the Universe
- History and Nature of Science
- Science as a human endeavor
- Nature of science
- History of science
Math Topics
- Measurement
- Graphing
- Unit conversions
- Ratios
- Scientific Notation
National Council of Teachers of Mathematics Standards (Grades 6-8)
- Number and Operations
- Understand numbers, ways of representing numbers, relationships among numbers, and number systems
- Algebra
- Understand patterns, relations, and functions
- Represent and analyze mathematical situations and structures using algebraic symbols
- Use mathematical models to represent and understand quantitative relationships
- Analyze change in various contexts
- Measurements
- Understand measurable attributes of objects and the units, systems, and processes of measurement
- Apply appropriate techniques, tools, and formulas to determine measurements
- Data Analysis and Probability
- Select and use appropriate statistical methods to analyze data
- Develop and evaluate inferences and predictions that are based on data
National Council of Teachers of Mathematics Standards (Grades 9-12)
- Understand numbers, ways of representing numbers, relationships among numbers, and number systems
All students should–
- develop a deeper understanding of very large and very small numbers and of various representations of them
- Compute fluently and make reasonable estimates
All students should–
- develop fluency in operations with real numbers, vectors, and matrices, using mental computation or paper-and-pencil calculations for simple cases and technology for more-complicated cases
- judge the reasonableness of numerical computations and their results
Literacy Skills
- Reading
- Writing
- Oral Presentation
National Council of Teachers of English Standards (All Grades)
1. Students read a wide range of print and nonprint texts to build an understanding of texts, of themselves, and of the cultures of the United States and the world; to acquire new information; to respond to the needs and demands of society and the workplace; and for personal fulfillment. Among these texts are fiction and nonfiction, classic and contemporary works.
3. Students apply a wide range of strategies to comprehend, interpret, evaluate, and appreciate texts. They draw on their prior experience, their interactions with other readers and writers, their knowledge of word meaning and of other texts, their word identification strategies, and their understanding of textual features (e.g., sound-letter correspondence, sentence structure, context, graphics).
4. Students adjust their use of spoken, written, and visual language (e.g., conventions, style, vocabulary) to communicate effectively with a variety of audiences and for different purposes.
6. Students apply knowledge of language structure, language conventions (e.g., spelling and punctuation), media techniques, figurative language, and genre to create, critique, and discuss print and non-print texts.
7. Students conduct research on issues and interests by generating ideas and questions, and by posing problems. They gather, evaluate, and synthesize data from a variety of sources (e.g., print and non-print texts, artifacts, people) to communicate their discoveries in ways that suit their purpose and audience.
- back to top -
Activity 1: Magnetic Fields on the Surface of the Sun
- back to top -
Student Objectives
-
Students will work collaboratively in a science team to explore magnetism in solar flares
-
Students will map the magnetic fields around a pair of sunspots on the Sun
-
Students will know what the Sun is and the physical properties of the Sun
-
Students will know what sunspots are and why they change appearance on the Sun
Materials Needed
| per group of students |
for lecture |
- 1 simple magnetic compass per student
- 2 Alnico bar magnets
- 6 sheets of white paper
- 1 pencil per student
|
- Computer with Microsoft PowerPoint installed
- Computer projector
- PowerPoint file from Exploring Magnetism website or overhead projector with transparencies
|
Getting Ready
Assemble the materials needed. Examine the compasses and make sure that they have the proper polarity; i.e. the needle should point toward the south poles of the bar magnets (the blue end if you are working with red and blue colored magnets). If the polarity of the compass is reversed, you can correct it by dragging one end of the magnet over the top of the compass needle such that the needle does not turn on its pivot. This is probably how the compass needle had its polarity reversed in the first place.
For the lecture, if you are able to display PowerPoint presentations in your classroom, you will find a ready-made presentation with notes for the lecture about magnetic fields on the Sun located here. Otherwise you should make transparencies from the pages in the Lecture section below and use the notes included with them.
Procedure
| 1. |
 |
Assemble students into groups of about four. Explain that these will be their Science Teams that they will work with throughout the entire series of lessons. Mention that scientists today usually work in teams. Sometimes the teams are very large and international. They do this to share knowledge and resources in the most efficient way possible.
[Note: It is strongly advised that this lesson guide be used after students have completed the activities found in the original Exploring Magnetism lesson guide. If the students have not experienced those activities, at the very least you should precede this activity with Activity 1 from Session 1 of Exploring Magnetism.
|
|
| 2. |
|
As in the magnetic field mapping activities from Exploring Magnetism, instruct students to tape together several sheets of blank paper on their tables.
|
|
| 3. |
|
3Have students arrange two bar magnets on the paper parallel to one another, about 3 inches apart, with opposite poles next to each other. Then have them tape the magnets in place. See Figure 4.1.
|
|
| 4. |
|
Using compasses and pencils, have students map the magnetic field lines around either ends of the pair of magnets.
To make the tracings, have the students do the following:
| a. |
Draw a dot somewhere near the magnet and place the center of a compass over the dot. |
| b. |
Draw a dot at the location of the arrow head (or tail) of the compass needle. |
| c. |
Move the compass center to this new dot, and again draw a dot at the location of the compass needle head (or tail). |
| d. |
Remove the compass from the paper and draw lines connecting the dots with arrows indicating the direction hat the compass points. |
| e. |
Continue steps b-d until the line meets the magnet or the edge of the paper. |
| f. |
Pick another spot near the magnet and repeat the process (steps a-e). |
|
|
| 5. |
|
Next give students Worksheet 4.1, with the illustration of a pair of sunspots on the surface of the Sun. The sunspots are labeled with an N and S indicating that each spot is has a magnetic polarity. Instruct students to draw what they think the magnetic field looks like above the surface of the Sun near the sunspots.
As an optional extension, have students verify their predictions by taping bar magnets to another copy of Worksheet 4.1 with the poles of the magnets aligned with the appropriate sunspots in the illustration. The students can then map the field with a compass as in step 4.
|
|
| 6. |
|
Give a lecture about magnetic fields on the surface of the Sun, using the materials and information given below. Have students take notes during the lecture using the Sunspots Lecture Graphic Organizer as their guide, which contains questions they should answer based on the lecture. Finally, pass out Worksheet 4.2 for students to answer based on the lecture.
|
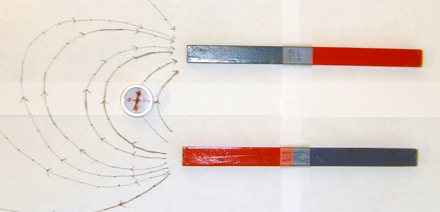
Figure 4.1 The student set-up for the magnetic field mapping activity. The magnetic field around one pair of poles is shown. Students may wish to map the area around both pairs of poles to discover the same shape for the magnetic field.
- back to top -
Sunspots Lecture
- back to top -
A lecture has been created for you to use to explain to your students how magnetic fields appear on the surface of the Sun and create sunspots and coronal loops. In the previous lesson guide, Exploring Magnetism in the Solar Wind, there is lecture prepared for teachers to explain what space weather is and how it affects Earth. Though there is some overlap in content between that lecture and the one presented here, the lecture here is focused on the Sun and how magnetism gives rise to sunspots.
The lecture files can be acquired by using the links below and are available either as a PDF document or as a Microsoft PowerPoint file. The PowerPoint file contains slide notes that the instructor may use while giving the presentation along with some movies embedded in the presentation (Note: the movie files must also be downloaded with the PowerPoint file). The PDF document is a full color version of the print version of the lecture and may be used via a computer projection system or can be used to make overhead transparencies.
The following pages contain the lecture slides that you may use to create overhead transparency slides. Also included are notes for each slide. These notes are intended to give you background information necessary to give the lecture and answer potential questions from students. The notes follow the text on the slides, but do not repeat it. The notes are not meant to be read allowed to the students, but are a guide for the teacher.
The Sunspots lecture can be downloded here:
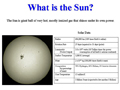
Slide 2: What is the Sun?
Remind students that when we look at an object nearby, it appears larger than when it is viewed from a distance. The stars are so far away that even the world’s best telescopes only see them as unresolved points of light.
You can explain that the idea that the Sun is a star was theorized by several ancient astronomers, but the proof of this did not come until the late 19th/early 20th century when the light from the Sun and stars was split into its component colors (spectra), recorded, compared and found to be the same.
Slide 3: What is the Sun? (part 2)
The Sun is a ball of really hot gas. Because it is so hot, most of the gas within it is ionized, meaning the atoms have had some number of electrons stripped off. So the Sun has lots of free electrons buzzing about with positively charged ions. This state of matter is often called a plasma. So it is also correct to state that the Sun is a giant ball of hot plasma.
Why does it shine? Because it is hot. All objects that are hot give off light. Human bodies have a temperature close to 300 degrees Kelvin and they glow in invisible light called infrared. When a object gets hot enough it will glow in visible light. For example, the heating elements of an electric stove or oven begin to glow red and orange as they get hotter. The surface of the Sun is 5,800 degrees Kelvin and that makes it shine in the visible part of the electromagnetic spectrum.
How does it get so hot and stay that way? The story starts with how the Sun formed under the influence of gravity.
Gravity pulls all matter together and the more matter there is, the stronger the force of attraction. The Sun has an enormous mass, and hence gravity acts to pull it all together. In fact, it tries to concentrate all that mass in its center. If there were nothing to stop it, gravity would have collapsed the newborn Sun into a black hole 5 billion years ago. But, as gravity compresses the matter that makes up the Sun, it also heats it up. The heating of the matter creates a pressure that pushes outward and prevents it from collapsing under its own weight.
However, the conversion of gravitational energy into heat cannot account for all of the heat in the Sun. In a matter of thousands of years, a star without another source of heat would quickly cool off and collapse into a shrunken heap. In the mid-20th century it was realized that the densities and temperatures in the core of the Sun were probably so high that it was possible for nuclear fusion reactions to occur. The simplest fusion reaction that occurs in stars like the Sun involves four hydrogen nuclei (protons) fusing into a single Helium nucleus (two protons & two neutrons). The reaction creates a heavier element and releases energy. By this process the Sun can shine as it does now for some 10 billion years. Radioactive dating of meteorites left over from the formation of the Solar System place the Sun’s age at about 5 billion years. So, it has another 5 billion to live on, much as it has for these past 5 billion years.
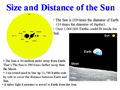
Slide 4: Size and Distance of the Sun
You may introduce your students to the term “Astronomical Unit” or AU. 1 AU is defined to be the average distance between Earth and the Sun (93 million miles; 150 million km).
When stating that over 1,000,000 Earths would fit inside the Sun, remind students of the difference between linear dimensions and volume. The diameter of the Sun is 109 times that of Earth, but its volume is 109x109x109 times bigger. If they have trouble with this concept ask them how many marbles they need to line up side by side to stretch from one wall of the classroom to the other side. It will probably be a few hundred. Then ask how many marbles it would take to cover the floor (a few tens of thousands). Finally, ask them to consider how many marbles they would need to fill the entire room with them: hundreds x hundreds x hundred = millions. (Note: the difference between rectangular and spherical volumes does not matter here. In a ratio between spherical volumes the factor of (4/3)*p cancels out. So all that matters is the ratio between radii.)
In the image, a cartoon view of the Earth and Sun, as seen from the Moon, is shown. The point here is that once students understand how much bigger the Sun is than the Earth, this view should impress upon them that the Sun must be very far away in order for it to look so small. In the image the Earth actually appears bigger than the Sun. This is because it is much, much closer than the Sun.
Introduce the idea that light travels at a finite and set speed. Light does not instantaneously move from one point to the next. It takes time for light to move from place to place. Light is pretty fast though. It moves at a speed of 300,000 km/s (186,000 miles per second). When talking about how long it takes light to travel to the Earth from the Sun, point out to students that this means that when we look at the Sun here on Earth, we see it as it was eight minutes ago. For probes that travel deep out into the Solar System, it takes light even longer to travel between them and Earth. We use radio communications (which is another form of invisible light) to talk to these probes. But there is a long delay since the signals have to travel such great distances. The nearest star to our Sun, Alpha Centauri, is so far away that it takes light four years to travel the distance. We see it as it was four years ago.
Slide 5: The Different Parts of the Sun
The Sun has layers, like an onion—or an ogre (like from the movie Shrek). The layer that our eyes can see is called the photosphere. It is the layer of the Sun that outputs visible light. We call the photosphere the Sun’s surface. However, it is not a solid surface that one could stand on. The density of gas there is much less than the density of air in Earth’s atmosphere. [Note: remind students not to stare at the Sun as it can cause permanent damage to their eyes.]
The layers beneath the photosphere are not visible. We determine their properties by carefully studying waves on the surface of the Sun that pass through its interior. Just as geologists infer the structure of the interior of Earth by studying how seismic waves produced by earthquakes travel and reflect throughout it, so, too, do solar scientists study how similar waves travel through the Sun’s interior. The study is called Helioseismology. Using this technique, along with physical theory about how gases behave under certain temperatures and pressure, solar scientists construct models of the Sun’s interior.
The core is extremely hot and dense. There, it is 15 million degrees Kelvin and the densities are so high that nuclear fusion reactions can occur. The reactions produce energetic gamma rays. Gamma rays are an invisible form of light and have the highest energy of all the kinds of light. To interest students who are into comics and superheroes, you might mention that it is gamma rays that transformed Bruce Banner into the Incredible Hulk. The gamma rays produced by nuclear fusion carry energy away from the core, out into the rest of the Sun.
Above the core, densities and temperatures drop and nuclear fusion reactions are not possible. Energetic light interacts with the matter here and heats it up, continuing to carry outward the energy produced from the core. This region is called the radiative zone, because electromagnetic radiation transports the energy out here. The way this happens is that light created in the core bumps into particles matter giving them some energy and randomly changing direction, somewhat like the puck in the game “Plinko” on the CBS game show The Price is Right.
Above the radiative zone, temperatures and densities are again lower—so far the Sun is just like other hot objects it gets cooler as you move away from the source of the heat. In this next layer, large parcels of gas carry energy outward through convection. Pockets of hot gas rise from low in this zone and cool as they rise, then fall back down, heating up as they go. Convection like this can easily be seen in lava lamps or miso soup when it is served hot. This region is known as the convective zone.
The top of the convective zone is the photosphere. High-resolution observations of the photosphere reveal the surface to be churning, due to the convective motions of the gas beneath it. The photosphere often appears splotchy-the technical term is granulation. This is caused by the hotter and cooler convection cells at the surface. Again, the average temperature of the photosphere is 5,800 K.
Above the photosphere, the density of gas continues to drop, but its temperature actually begins to rise. The thin layer just above the photosphere is called the chromosphere. Here the temperature rises to about 10,000 degrees Kelvin. Unlike most hot things, it actually starts getting hotter as you move away from the surface. This layer produces most of the ultraviolet light that leaves the Sun. The chromosphere is visible to special telescopes that can make images using ultraviolet light. It is also visible in a specific red color of visible light produced by hydrogen; scientists often refer to this color as H-alpha (wavelength = 656.3 nanometers1 nanometer is a billionth of a meter). Some optical telescopes are made with special filters that block all light except this red color, allowing the observer to see the chromosphere.
Above the chromosphere is the Sun’s outer atmosphere. It is called the corona, and can be seen in visible light during total eclipses of the Sun. It extends far out into interplanetary space. In fact, it extends out to as much as 100 times the distance between the Earth and the Sun. The density of the corona is very low (around 1 proton per cubic centimeter), but the temperature is very high, around 1,000,000 degrees Kelvin. The corona is so hot that it emits extremely energetic ultraviolet light as well as X-rays.
Note: Even though the corona has a very high temperature, it has very little thermal energy. This is because its density is very low. Temperature measures the average energy of particles in a substance, but thermal energy measures the total energy of all the particles. Even when all the particles individually have a lot of energy, if there are very few of them, then the total energy is low. Think about the difference between an oven and boiling pot of water. The temperatures used for cooking in an oven are often much hotter than the temperature of boiling water (373 K). Yet one regularly can stick their hand into a hot oven to remove the contents without getting burned, whereas one would not even think about sticking their hand in a pot of boiling water to remove the contents. The water has a lower temperature, but its density is so much greater. So the thermal energy in the water is actually greater than the thermal energy in the oven.
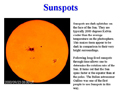
Slide 6: Sunspots
The rate of energy output (called luminosity) of a hot object is a function of its temperature. The hotter the object, the greater the luminosity. But the proportionality between luminosity and temperature is not linear. The luminosity of an object is proportional to its temperature to the fourth-power. So, doubling the temperature of an object increases its luminosity by a factor of 16. This is why sunspots are so much darker than the surrounding photosphere. They are on average 2,000 K cooler than the photosphere and 5 times dimmer.
However, 4,000 K is nothing to scoff at. The temperature of the elements in common light bulbs are often at around 4,000 K and clearly produce plenty of visible light. Sunspots are actually quite bright. In fact, if one could block out all of the light from the normal photosphere of the Sun and just allow the light from sunspots to come through, our daytime sky would appear almost as bright is it does normally.
The reason we see sunspots as dark splotches, with our eyes and with our electronic imaging devices is a matter of contrast. The photosphere is so much brighter than the sunspots that the dynamic range of images cannot account for the large difference in brightness, and so we see the sunspots as dark.
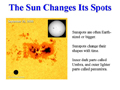
Slide 7: The Sun Changes Its Spots
Sunspots are not permanent features on the Sun; they come and go and change in appearance.
In this high-resolution image, you can see the enormous sizes that some sunspots reach. You can also see the mottled appearance of the photosphere, which is a result of the convection of huge parcels of gas beneath. Note that the sizes of the convection cells are quite large themselves in relation to the size of Earth.
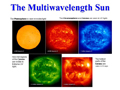
Slide 8: The Multiwavelength Sun
Note in this sequence of images that the bright spots in the ultraviolet and X-ray images of the Sun’s Chromosphere and corona correspond to the locations of sunspots on the photosphere.
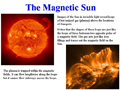
Slide 9: The Magnetic Sun
The image on the left is from the SOHO (SOlar and Heliospheric Observatory) spacecraft. The wavelength of light is lower energy ultraviolet, which reveals the Sun’s chromosphere. Seen here is an enormous loop of gas trapped in a magnetic field. Loops of this size are called prominences.
The image on the right is from the TRACE (Transition Region And Coronal Explorer) spacecraft and uses higher energy UV light to study the Sun’s corona. The image reveals ribbon-like coronal loops. Again we are seeing plasma flowing through a magnetic field.
Remember that plasma is charged gas, and that a charged gas in motion is an electrical current. Electrical currents, in turn, generate magnetic fields. Likewise, magnetic fields that change with time can generate electric fields which push charges around. The complex interaction of these effects creates the tangled mess of coronal loops seen in these images, and affects how they change with time.
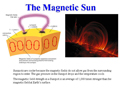
Slide 10: The Magnetic Sun (part 2)
Putting all the information together creates a picture where sunspots are the “footprints” of the coronal loops. The coronal loops are made of plasma trapped in a very strong magnetic field. That same magnetic field penetrates down into the convection zone and inhibits the convection of gas in that region. This causes the gas there to cool faster than the surrounding region.
The average strength of the magnetic fields in sunspots is around 1,000 Gauss (Gauss is a unit of magnetic field strength). The average field strength on the surface of Earth is about ½ Gauss, and the average magnetic field strength on the surface of the Sun is about 1 Gauss. So the magnetic fields in sunspots are extremely strong.
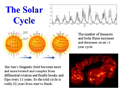
Slide 11: The Solar Cycle
The Sun has an overall magnetic field much as Earth does. In general, it resembles the dipole field of a bar magnet. It is thought that the field is generated by currents of electric charges in the convection zone of the Sun.
Because the Sun is gaseous it does not rotate like a solid body. It rotates differentially; the equator rotates faster than the poles. In a plasma, charged particles cannot cross from one magnetic field line of force to another neighboring field line. So, in this way the magnetic field becomes “frozen” into the plasma. If the particles move with some bulk motion due to a different force they will drag the magnetic field with them. This can distort the magnetic field if different parts of the gas move at different rates or in different directions. This is what happens to the Sun. The regular dipole magnetic field gets twisted and wrapped up as a result of the differential rotation of the Sun.
As the field becomes more and more twisted, little loops of the magnetic field push up through the surface forming sunspots and coronal loops. Eventually, the field becomes so complex that it essentially breaks and reforms into a simpler shape. This process is what is thought to be behind the observed solar cycle. The Sun goes through a cycle of periods when it has many sunspots and active regions in its corona and then it has periods where it is relatively free of sunspots and is very quiet. The period of the cycle is 11 years and has now been observed for several centuries.
The polarity of the Sun’s magnetic field flips every 11 years, and so the complete solar cycle is actually 22 years for the Sun to return to its original state.
- back to top -
Sunspots Lecture - Graphic Organizer
- back to top -
Title Slide

|
Slide 2- What is the Sun?

-
How are the stars we see at night related to the Sun?
-
How are they different?
|
Slide 3- What is the Sun? Part 2
-
What is the Sun?
-
Why does it shine?
-
How does it get so hot and stay that way?
|
Slide 4- Size and Distance of the Sun
-
Define an Astronomical Unit.
-
What is the size of the Sun compared to the Earth?
-
How long does it take light to reach the Earth from the Sun?
|
Slide 5- The Different Parts of the Sun

-
Describe the different layers of the Sun?
-
How does the density and temperature of the Sun vary as one moves from the center outward?
|
Slide 6- Sunspots
-
What are sunspots?
-
What does temperature have to do with luminosity?
|
Slide 7- The Sun Changes It Spots
|
Slide 8- The Multiwavelength Sun
-
What wavelengths are you viewing from these images?
-
What parts of the Sun are revealed by using invisible forms of light to observe it?
|
Slide 9- The Magnetic Sun
-
What are prominences?
-
What are we viewing in the image on the left?
-
Describe plasma and its connection to electric currents.
|
Slide 10- The Magnetic Sun
-
What are coronal loops made of?
-
Are the magnetic fields in sunspots strong? Explain.
|
Slide 11- The Solar Cycle
-
Compare the Sun’s overall magnetic field to Earth’s.
-
How is the magnetic field of the Sun created?
|
Reflection:
Describe the main ideas you have learned about the Sun, sunspots, and the magnetism of the Sun. |
- back to top -
Activity 2: Magnetic Energy and the Cause of Solar Flares
- back to top -
Student Objectives
- Students will know the physical properties of electromagnetism
- Students will know the law of conservation of energy
- Students will know the difference between potential and kinetic energy
- Students will know that solar flares are caused by magnetic fields in the atmosphere of the sun
- Students will know that solar flares release energy in the forms of light, heat, and the kinetic energy of large clouds of plasma
Materials Needed
- A coil of copper wire (about 7 meters long, covered with an insulating enamel)
- Small patch of sand paper for removing wire enamel at connection points
- 2 insulated wires with alligator clips
- 3 or more batteries (D-cells, 9-volt, etc.) with battery holder
- 1 knife switch
- 1 Ammeter or Galvanometer
- 1 bar magnet and/or cow magnet
Getting Ready
Gather materials listed above. Set up an electrical circuit with the coil of wire in the circuit. Leave the knife switch open. Also assemble the set-up for Exploring Magnetism: Session 2: Activity 5: Electric Current Generated with a Moving Magnet. This will be a circuit with a coil and ammeter and no voltage source or knife switch. See Figure 4.2.
| 1. |
|
If you have not done the activities from Exploring Magnetism it is advised that you consider doing at least Activities 4 and 5 from Session 2 in that lesson guide. These activities allow students to discover that electrical currents create magnetic fields, which push on a magnet, and that moving magnets create electrical fields which push on charges and create a current.
|
|
| 2. |
|
Review with your students the outcomes from the experiments in Activities 4 and 5 in Session 2 of Exploring Magnetism. The basic concepts to stress are that changing electric fields create magnetic fields and that changing magnetic fields create electric fields.
|
|
| 3. |
|
Demonstrate that moving electric fields (current) create magnetic fields with the jumping coil circuit. Rest the coil of wire on the edge of a strong magnet and close the knife switch. The coil will become a magnet and will either jump off the coil (due to the magnetic repulsion of like poles) or pull toward the center of the magnet (due to the attraction of opposite poles). Simply turn the magnet around to make the coil either jump or pull toward the center of the magnet.
|
|
| 4. |
|
Demonstrate that moving magnetic fields create electric fields that push charges (and create electric currents) using the galvanometer set-up. Here, simply move a magnet through the center of the coil. As you are moving the magnet back and forth, the needle on the galvanometer will register current moving through the circuit. You’ll notice that as the direction of the magnet changes so, too, does the direction of the current.
|
|
| 5. |
|
Remind students that these two basic experiments were the ones that helped scientists in the 19th century realize that electricity and magnetism were not separate phenomena, but actually two different manifestations of a single force field, which they called the electromagnetic field.
|
|
| 6. |
|
While doing the previous step discuss with students the concept of energy. Ask them, “Am I creating energy by moving this magnet through the wire?” Many will likely think so, but the answer is, “No.” You are merely transforming one form of energy into another. Talk with students about how chemical reactions in your muscles are converting chemical potential energy into kinetic energy of your hand and the magnet. Some of the kinetic energy of the magnet is being converted into electric potential energy (creating a voltage) which is then converted into the kinetic energy of the charges moving in the wire.
You might also discuss with students how the transfer of energy is not perfect. Much of the chemical energy produced in your muscles goes into heating them up, just as much of the kinetic energy of the charges in the wire is also lost to heating it up. You can ask, “When something is heated up, is the energy really lost?” Again, the answer is “No. Energy is never lost only transformed.” When energy goes toward heating something up it is transformed into the kinetic energy of individual particles all moving in random directions, called thermal energy.
Heated objects, such as your arm or the wires, can also “lose” energy (cool) by giving off light. If the students scoff at this, noting that neither your arm nor the wire are glowing, tell them that objects glow whenever they have some thermal energy. However, your arm and the wire are not hot enough to glow in visible light. But they are hot enough (about 300 K) to glow in infrared light. The cooler an object is, the lower the energy is of light that it gives off. So, your arm and the wire are not hot enough to glow in visible light, but light bulbs are. The filament of a light bulb is just a really hot piece of metal. It gets hot when an electrical current runs through it and heats it up to about 4,000 K
|
|
| 7. |
|
Finally, pass out the Solar Flares essay, Solar Flare Cornell Notes, and Worksheet 4.3. Assign them to read the essay as homework, filling out the Cornell Notes as they do. When they have finished reading the essay they should complete the worksheet for the next class session. Worksheet 4.3 can be used as an assessment of the student’s understanding of the material in this activity. Note that this essay has a Flesch-Kincaid Reading Grade Level of 9.7.
Suggestion: to save time or to help English language learners you could split up the text and assign different students to read different sections and then have students assemble in groups to jigsaw the text and complete the Cornell Notes and Worksheet.
|

Figure 4.2 Set up for the demonstrations. The three panels on the left show the set-up for the jumping coil. The circuit diagram in the top of the right column is for the jumping coil. The set-up for the galvanometer demo is shown in the bottom two images of the right column.
- back to top -
Solar Flares
- back to top -
Solar flares are the most powerful explosions in all the Solar System. They appear as sudden, rapid, and intense increases in brightness in relatively small regions in the Suns atmosphere. They can have impacts on our lives here on Earth and on astronauts living and working in space. The amount of energy released in a single solar flare is ten million times greater than the energy released from a volcanic explosion here on Earth.
Solar flares occur when magnetic fields in the Suns atmosphere rapidly change shape and generate currents of electrically charged plasmas. The energy released by flares takes the form of light, heat, and the movement of large amounts of plasma. Light from across the entire electromagnetic spectrum, from radio waves to gamma rays, can be generated in the biggest flares. Some flares also seem to generate gigantic eruptions of matter that are ejected out into interplanetary space. Such eruptions are called Coronal Mass Ejections (or CME for short). The name is very descriptive as these events are literally ejections of mass from the Suns corona. Flares also heat up the plasma in the corona and chromosphere of the Sun. The temperature of the corona is very high. This is unusual since most hot objects get cooler as distance from the heat source increases (the source of the Suns heat is in its core). New observations from the NASA spacecraft RHESSI (Ramaty High Energy Solar Spectroscopic Imager) suggest that the curiously high temperature of the corona may be caused by large numbers of very small solar flares that occur frequently.
Scientists have known for a long time that magnetic fields play a major role in solar flares, but they do not yet have a complete understanding of how. The simplest model that scientists have proposed for how magnetic fields on the Sun cause solar flares involves sunspots. Sunspots are places where strong loops of the Suns magnetic fields poke through the Suns surface (called the photosphere). The magnetic fields trap plasma inside them and do not allow plasma outside the loops inside. This causes the area to be cooler than average on the photosphere and makes sunspots appear darker. Above the sunspots, the magnetic field loop also traps hot plasmas, these are called coronal loops. See the image in Figure 4.3 for an example of a coronal loop viewed in ultraviolet light. So, sunspots can be thought of as the visible footprints of coronal loops.
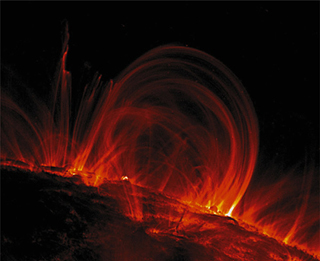
Figure 4.3 This is an image of hot plasma trapped in magnetic fields in the Suns corona, called coronal loops. The image was taken in Ultraviolet light by NASAs TRACE satellite. The red color is for illustrative purposes only; ultraviolet light has no color, since it is invisible to the human eye.
Sunspots drift in position relative to one another on the photosphere because of convection beneath the photosphere plus the differential rotation of the Sun. All of these motions distort the sunspots magnetic fields and cause them to twist up and become more and more complicated in shape. The more complicated the magnetic fields shape become, the more energy they store.
In the simplest scenario for what occurs during a solar flare, a coronal loop starts out with the basic shape (Figure 4.4, panel 1) and then begins to change in such a way that it looks as though it is a rubber band being pulled upward (Figure 4.4, panel 2). As the field stretches, it creates electric fields that start pushing the plasma trapped inside in a variety of directions. The plasma can still only travel along the field lines. When the field becomes stretched enough a point forms in the loop where the magnetic field is pointing in opposite directions; its called an X-point because the shape of the magnetic field there is like an X (Figure 4.4, panel 4). At this place in the magnetic field the shape suddenly changes. Plasma is forced into the X-point and then accelerated both up and down along the field lines (Figure 4.4, panel 5). When plasma crashes into the denser gas of the Chromosphere it heats it up and releases a great deal of light, sometimes even X-rays and gamma rays. Plasma from above the loop is squirted down to the top of the loop, where another hot spot forms glowing in X-rays (Figure 4.5). In some cases a magnetic bubble forms above the loop, into which matter is also squirted. Plasma piles up near the bottom of the bubble and heats up causing it to glow in X-rays also. At the end of the process, the bubble separates from the loop and is pushed away from the Sun at incredible speeds (Figure 4.4, panel 6). The loop returns to a more simple shape since it has released much of the energy that was stored up in its more complicated shape.
Follow the Energy
Solar flares release enormous amounts of energy. But where does it all come from? Do the magnetic fields generate the energy? No. Recall that one of the fundamental principles of physics is that energy and matter can neither be created nor destroyed. However, they can change form.
Energy is an abstract concept. One way to think of it is as a measure of a system’s ability to change motion. There are two fundamental forms of energy:
Kinetic Energy – the energy of motion
Potential Energy – the amount of change in motion that can potentially be done
The total amount of energy in any closed system never changes; it only changes form. There are many forms of energy that you have probably heard of or encountered: electrical, magnetic, chemical, nuclear, light, gravitational, thermal, heat, etc... All of these forms are really just different kinds of the two basic forms of energy: Kinetic and Potential. For example, chemical energy stored in foods is potential energy of electrons in atoms and molecules. Light is another very important form of energy. In a sense it is pure kinetic energy. It is always in motion, moving electric and magnetic energy through space. Thermal Energy is also a very important form of energy. It is the kinetic energy of all the particles making up a substance as they vibrate and move around in random directions. Heat is energy that flows from hot to cool objects. When it is said that something is being heated this means that its thermal energy is being increased.
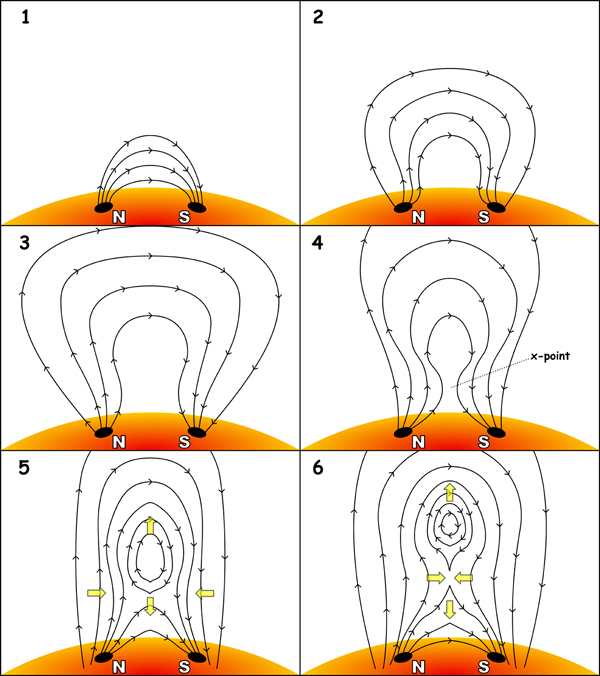
Figure 4.4 A sequence of diagrams shows the evolution of a magnetic field during a solar flare. The yellow arrows indicate the directions that plasma moves during the flare.
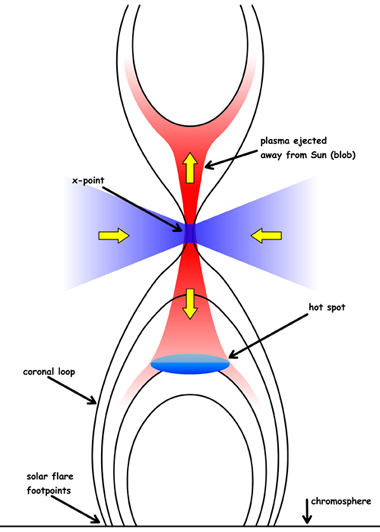
Figure 4.5 An annotated diagram illustrates the magnetic field and plasma movement during a solar flare. The yellow arrows indicate moving plasma due to the changing magnetic field.
There are several different units that people use to measure energy: Joules, ergs, electron-volts, or calories. Physicists, astronomers, and engineers often use the units of Joules, ergs, or electron-volts (eV) to measure energy. However, chemists and biologists might more often use calories to measure energy.
Some definitions:
1 Joule = 1 kg m2/s2 = 107 ergs = 6.242 x 10¹⁸ eV
1,000 calories = 1 Food Calorie = 4,186.8 Joules.
Note that nutritionists use the unit of Food Calories, which is equal to 1 kilocalorie (1,000 calories). But, they do not use the term kilocalories. Instead, they use Calorie (with a capital C to indicate a kilocalorie). This is admittedly very confusing. 1 Calorie (with a capital C) is defined as the amount of energy required to raise the temperature of 1 kg (i.e. 1 liter) of water by 1 degree Celsius (or Kelvin).
When you buy food in a store the label often tells you how many Calories there are in that food. For example, a typical candy bar contains 250 Calories. The label is telling you how much potential energy is chemically stored in the food. If you eat the food, your body will use chemical reactions to convert that potential energy into other forms of energy to do work for your body. The typical person needs to consume 2,000 Calories per day for normal functioning.
To equal the energy in 1 solar flare (see Table 4.1) you would have to eat 100 quintillion candy bars, or every human being on the planet would have to eat one candy bar every minute for the next one billion years!
Tracing the Energy of a Solar Flare
When a solar flare occurs it releases energy in several different forms. First, there is the overall kinetic energy of tons upon tons of moving plasma. When that plasma crashes into other matter in the corona and chromosphere it transfers its kinetic energy into the chaotic and random motions of particles in the surrounding matter. This is what we call thermal energy, the sum of the all the kinetic energy of all of those particles moving in a disordered way.
| Energy Comparisons: |
| |
Calories |
Joules |
# of Candy Bars (250 Cal each) |
| Lifting a lemon 1 meter |
2.388 X 10⁻⁴ |
1 |
9.55 x 10⁻⁷ |
| Car moving at 60 mph |
86 |
3.6 x 10⁵ |
0.34 |
| Burning a liter of oil |
287 |
1.6 x 10⁶ |
1 |
| Human daily diet |
2 X 10³ |
8.4 x 10⁶ |
8 |
| Lightening bolt |
106 |
1010 |
104 |
| Heat a house (1 year) |
107 |
1011 |
105 |
| 1-megaton H-bomb |
1 x 10¹² |
5 x 10¹⁵ |
4 x 10⁹ |
| Earthquake (magnitude 8.0) |
6 x 10¹² |
2.5 x 10¹⁶ |
2.4 x 10¹⁰ |
Annual U.S. energy usage
|
1016 |
1020 |
1014 |
| Impact of dinosaur extinction asteriod |
1019 |
1023 |
1017 |
| Annual sunlight on Earth |
1021 |
1025 |
1019 |
| Large solar flare |
1022 |
1026 |
1020 |
| Earth spinning |
1025 |
1029 |
1023 |
| Earth moving in orbit |
1029 |
1033 |
1027 |
| Annual solar energy output |
1030 |
1034 |
1028 |
| Supernova (exploding star) |
1040 |
1044 |
1036 |
Table 4.1 A comparison of the amount of energy in a variety of systems or phenomena
Light is also produced in solar flares. It comes from two sources, one source is the plasma moving through a magnetic field. When charged particles move through a magnetic field they do not follow straight paths but spiral around. This spiraling motion is an acceleration that causes the charged particles to radiate light away. The second source of the light is the heated matter. One way that heated matter cools is by releasing energy in the form of light.
If a CME erupts following a solar flare then there will also be kinetic energy in the bulk motion of the several billion tons of matter that are spewed out into interplanetary space.
Where does the solar flare get all the energy that it releases? It comes from the energy stored in the twisted and tangled magnetic field. However, tangling and twisting a magnetic field also takes energy. Where does that energy come from?
The Suns magnetic field is thought to be generated in the convection zone of the Sun where giant blobs of hot gas rise, cool, and then sink back down in the process called convection. The rising and sinking motion of the charged gas along with the Suns rotation generates large electrical currents. Those currents create the magnetic field. Where does the energy to cause convection and the Sun to spin come from?
The amount of energy in the Suns rotation is a combination of the mass of the Sun, its size, and how fast it spins. The faster it spins, the more energy it has. Those three properties of the Sun were a result of the way in which the Solar System itself formed.
Thermal energy, generated by interactions with matter deeper inside the Sun, leads to the convection of gas in the Sun. In the Suns core, temperatures are very high and matter is very dense. Under these conditions nuclear fusion takes place. Nuclear fusion is a reaction where nuclei of hydrogen fuse together to create helium. The reaction releases high-energy light in the form of gamma rays. The gamma rays randomly collide with particles in the surrounding matter and give them some random kinetic energy. This heats up the core (increasing its thermal energy). Where did the energy come from to make the core so hot and dense and produce nuclear fusion?
The core is so dense and hot because of the Suns mass. It is so massive that gravity pulls all the matter together, compressing it with great force. Compressing the gas acts to heat it up and make it dense.
So, when we trace the energy that is released in a solar flare (and all the other energy released by the Sun as well) we find that the Suns mass is a common source of it all. Of course, the energy wasnt created with the Suns mass either. But that is another story
- back to top -
Solar Flares Cornell Notes
- back to top -
The Solar Flares Cornell Notes can be downloaded here:
- back to top -
Activity 3: Measuring the Speed of an Ejected Ball of Plasma
- back to top -
Student Objectives
- Students will evaluate real images of solar flares.
- Students will recall and apply what they learned from Activity 2 to predict the magnetic field around a sunspot.
- Students will graph position versus time of a blob of coronal plasma from RHESSI images.
- Students will use real data and one of two methods for determining the speed of an ejected ball of plasma.
- Students will calculate the kinetic energy of a blob that was ejected from a solar flare moving away from the sun as a coronal mass ejection.
- Students will calculate the strength of the magnetic field that caused a solar flare and CME.
Materials Needed
- 1 set per group of RHESSI images of flare # 2041509
- rulers
- pencils
- graph paper
- calculators (optional, a brain works pretty good too)
Getting Ready
Make photocopies of the Worksheets, the RHESSI Flare Images info sheet, and a set of RHESSI flare images per group. You may also wish to prepare several overheads from example images provided in this activity and in the Background Section. Related videos are avialable in the Background Material section.
Procedure
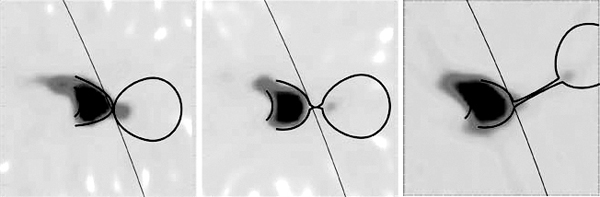
Figure 4.6 The shape of the magnetic field around flare # 2041509 as determined by RHESSI scientists. These images are the same as the other RHESSI images and represent a scale of 94,250 km x 94,250 km near the edge of the western side of the Sun.
5.
|
|
Next, hand out Worksheet 4.5, a set of RHESSI images of flare # 2041509, and graph paper to the Science Teams. Tell them that they will now act like scientists and will analyze their data to determine some characteristics of the solar flare. Note that there are two versions of the images provided. One set has the locations of the “footprints” of the coronal loop causing the flare marked with X’s. Also a circle is marked in the images to indicate the midpoint between the footprints. This point is to be used as the reference point from which the students will measure the height of the X-ray blob. The second set does not have these points marked and it is left up to the students to determine how to locate the footprints and midpoint. They will essentially have to make an educated guess at the locations of the footprints based on the coronal loop. Then they can use those points and the midpoint formula to find the midpoint. You may use whichever set you think will work best for your class.
In their teams, students should examine each image and determine the location of the brightest spot in the coronal X-ray source (a.k.a. “the blob”), which is above the coronal loop. Using a ruler, they should then draw cross hairs through that spot reaching the axes so that they can read off the coordinates of the spot (See the example on the next page, which you can use to make an overhead for demonstration purposes).
Next, students will need to determine the height of the blob above the surface of the Sun. This can be done in a number of ways.
Method 1: Students use a ruler to measure the distance between the midpoint of the coronal loop footprints and the blob. They will then need to convert their measurement into arc-seconds and then into kilometers. To convert their measurement into arc-seconds, they should line up their ruler (whichever side they used, centimeters or inches) with one of the axes of the image. They can read off how many arc-seconds there are per either inch or centimeter. Then they can multiply their measurements by that factor. Finally, they need to multiply the number of arc-seconds by the conversion factor of 725 km/arcsec (See the explanation in the RHESSI Solar Flare Images info sheet).
Method 2: Students use the formula for the distance between two points to calculate the height, since they already have the coordinates for the blob.
height2 = (x1 – x2)2 + (y1 – y2)2
The coordinates for the midpoint is (852, 360) arc-seconds. For reference, the coordinates of the footprints are: (840, 372) & (864, 348) arc-seconds. Following that they must once again convert the height in arc-seconds into kilometers using the image scale of 725 km/arcsec.
-----------------------------------------------------------------------------
Students should then plot the data on a graph. The x-axis will be time and the y-axis will be height above the surface of the Sun in kilometers. They will not draw lines through the points, just plot the points.
Students should return to their data table and calculate the distance moved between each pair of points, and then use that information in connection with the time interval between each image to calculate the average speed of the blob between pairs of points.
Finally, students will take a ruler and draw a line segment that goes through the last three points, when the blob takes off. They will calculate the slope of that line. The value of the slope will be the speed with which the blob ejected away from the Sun.
Example Data are given in Table 4.2 and plotted in Figure 4.8.
Students will lastly be asked about when the blob separates from the coronal loop, when the blob experiences the greatest acceleration and strongest net force. All these things happen around the 7th frame or around 23:12:00 UT. That is when there is the most extreme change in the speed (slope) of the blob in the graph. Students with training in calculus will recognize this spot as where the derivative is maximized. Newton’s second law of motion states that force is directly proportional to acceleration (where mass of the object is the constant of proportionality, F = ma). The source of that force is the magnetic field. As the magnetic field evolves, it creates an electric field which pushes the charged gas away from the Sun at quite a fast speed. Your students should find the speed to be 250-300 km/s.
|
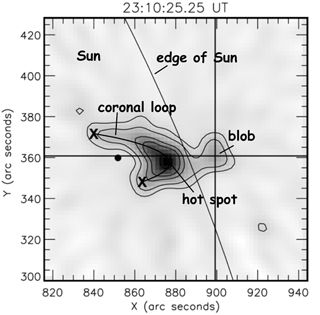
Figure 4.7 Drawing cross-hairs through the brightest point of the blob
Time |
Time Interval
(sec) |
X-Ray Source
Position |
Height
(arc sec) |
Height
(km) |
Distance Moved
(km) |
Speed
(km/s) |
X |
Y |
| 23:10:04.50 |
20.75 |
897 |
359 |
45.0 |
32,633 |
|
|
| 23:10:25.25 |
20.75 |
899 |
361 |
47.0 |
34,083 |
1,450 |
70 |
| 23:10:46.00 |
20.75 |
899 |
361 |
47.0 |
34,083 |
0 |
0 |
| 23:11:06.75 |
20.75 |
896 |
359 |
44.0 |
31,908 |
-2,174 |
-105 |
| 23:11:27.50 |
20.75 |
899 |
364 |
47.2 |
34,198 |
2,290 |
110 |
| 23:11:48.25 |
20.75 |
900* |
366* |
48.4 |
35,071 |
873 |
42 |
| 23:12:09.00 |
20.75 |
903 |
361 |
51.0 |
36,982 |
1,911 |
92 |
| 23:12:29.75 |
20.75 |
909 |
369 |
57.7 |
41,837 |
4,855 |
234 |
| 23:12:50.50 |
20.75 |
915 |
374 |
64.5 |
46,789 |
4,952 |
239 |
Table 4.2 Example Data for Worksheet 4.5. Note that the measurement for the image taken at 23:11:48.25 is a difficult one; student measurements of this image should be expected to vary by a large amount.
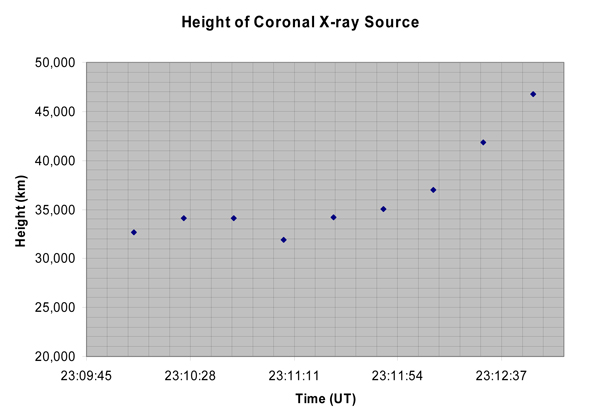
Figure 4.8 Plot of Example Data in Activity 3
Going Further
| 6. |
|
If your students have studied the concept of kinetic energy, then they can go one step further and make an estimate of the kinetic energy that the blob has as it is ejected by the flare. Hand out Worksheet 4.6 to have students make the necessary measurements and calculations. When they have a number, they can compare it to the total light energy that the flare released as well as the energy of other events discussed in the essay from Activity 2. |
|
7. |
|
Finally, your students can estimate the minimum strength of the magnetic field in the coronal loop. They will do this by using the equation for magnetic energy density and equating the energy released by the flare with the amount of magnetic energy contained in the coronal loop. They will be asked to take the equation and algebraically solve for the magnetic field strength, B. They will then have to estimate the volume of the coronal loop by assuming it to be a cylinder curved into a semicircle. Handout Worksheet 4.7 for students to do the necessary measurements and calculations. Afterward discuss with students the strength of the field they calculate relative to the strengths of other magnetic fields, as shown in the Table 4.3.
|
| Magnetic Field Comparison: |
| Object |
Magnetic Field Strength (Gauss) |
| Earth's field at surface |
0.6 |
| Common bar magnet |
100 |
| Strong sunspots |
4000 |
| Stronest manufactured magnets |
4.5 x 10⁵ |
| Strongest stellar magnetic fields |
1 x 10⁸ |
| Normal neutron star (radio pulsars) |
1012 - 1013 |
| Strongest neutron star fields (magnetars) |
1014 - 1015 |
Table 4.3 Comparison of magnetic field strengths of various objects
- back to top -
RHESSI Solar Flare Images
- back to top -
The images for the activity in Worksheets 4.4 & 4.5 are a sequence of images, constructed from observations of high energy X-rays from the Sun made by the RHESSI spacecraft on April 15th, 2002. The images are zoomed in on a region in northwest quadrant of the Sun. The long curved line running through the center of the images is the edge of the Sun.
In the images, the axes are given in arc-seconds. Arc-seconds are a unit of angle. They are a subdivision of degrees. There are 60 arc-seconds in an arc-minute and 60 arc-minutes in a degree. Thus, there are 3,600 arc-seconds in a degree. Imagine a right-triangle with two points on the surface of the Sun and one point on Earth. If the angle between the two lines connecting Earth and the Sun were one arc-second then the distance between the two points on the Sun would be 725 kilometers. So in the images, one arc-second equals 725 kilometers. The center of the coordinate system is the center of the Sun (see Figure 4.9).
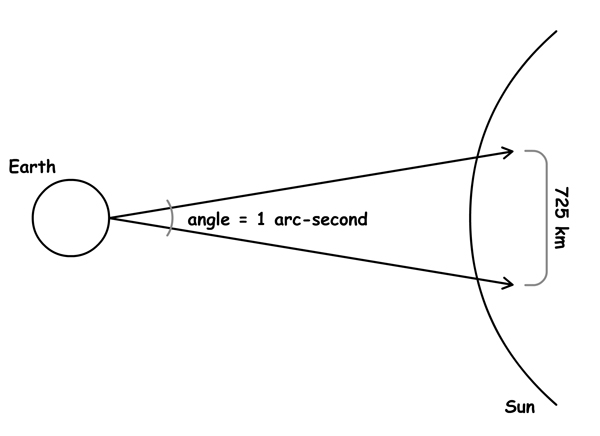
Figure 4.9 An illustration depicting an arc-second
The time that the image was taken is given at the top of each image in Universal Time (UT). Universal Time is the time kept in the time zone centered on Greenwich, England (longitude zero). Universal Time does not participate in daylight savings time, so there is no springing forward or falling back one hour during the year. UT times are given in terms of a 24-hour clock. Thus, 14:42 is 2:42 p.m., and 21:17 is 9:17 p.m. For example, in the winter, when it is 6:00 am Pacific Standard Time in Oregon, it is 7:00 am in Montana, 9:00 am in Pennsylvania, and 14:00 Universal Time.
The image is black and white. To make the solar flare more visible, and for the ease of this activity, white represents faint emission of X-rays and black indicates bright emission of X-rays. This is like a photo-negative. For further clarity, contour lines have been added to the images to accentuate the shape of X-ray emission at certain brightness values. This is similar to contour lines drawn on maps, where each line represents a certain height. Here the contour lines represent a specific level of X-rays brightness. The outer lines are fainter and the inner lines are brighter.
The shape of the contours outline the coronal loop that is the source of the flare. The brightest spot in the image is the top of the coronal loop where plasma is being squirted down and crashing into it. There is a secondary bright spot above the loop that slowly lifts away from it, and in the last frames, is ejected up and away from the coronal loop and the Sun. A coronal mass ejection (CME) was later observed by the SOHO spacecraft (see the movie online) originating from that part of the Sun.
The RHESSI Solar Flare Images can be downloaded here:
- back to top -
Activity 4: Science Conference
- back to top -
Student Objectives
-
Students will work collaboratively in creating an abstract containing the information they feel is important in their studies of the Sun, sunspots, and solar flares.
-
Students will orally present what they have learned about solar flares and sunspots using their abstract and a poster board.
Materials Needed
| required |
optional |
-
Colored construction paper
-
Graph paper
-
Glue
-
Scissors
-
Colored pens, pencils, markers, etc.
-
Project boards
-
Overhead transparencies
-
Overhead projector
-
Name tags
|
- Computers with presentation software installed (such as Microsoft PowerPoint) as well as spreadsheet and graphing software (such as Microsoft Excel)
- Computer projector
- Color printers
- Poster printer
|
Getting Ready
Gather the materials needed and make copies of the information sheets to be handed out to students: Guidelines for Science Conference Abstracts, and Guidelines for Science Conference Presentations.
Procedure
| 1. |
|
Assemble students once more into their science teams. Explain that one of the professional activities of scientists is communicating their work to their colleagues across the nation and the world. One of the common ways that they do this is by attending science conferences and presenting their work usually through oral or poster presentations. Explain that the class will have a mock science conference where the topic of the conference will be the role of magnetic fields in solar flares.
|
|
| 2. |
|
The first step in preparing to present at a conference is to decide what aspect of your research to report on. Then decide whether to present a poster or to give a talk, and then submit a proposal abstract to the conference organizing committee (a.k.a. you). Have the students consider all the work they have done for this past three activities and decide which aspects they would like to report on. Hand out to them the Science Conference Project Sheet to help them organize their work. Tell students that they should work together in their teams in preparing their abstracts that they will submit to you for either talks or posters. Limit them to 250 words. Hand out to students the Guidelines for Science Conference Abstracts instructions. If you would like your students to see real examples of scientific abstracts, you can use NASAs Astrophysics Data System Abstract Service to search through thousands of abstracts in Astronomy, Physics, and Geology.
|
|
| 3. |
|
After you collect the abstracts, decide for yourself which ones will make for good talks and which should be posters, and then inform the students of your decision. This is often done by conference session organizers. If time allows, it is ideal if all groups develop both a poster and an oral presentation.
|
|
| 4. |
|
Have the students work in the science teams to prepare either talks or posters to present at the conference. Hand out to students the Guidelines for Science Conference Presentations instructions for students to follow when creating science posters or talks. For example, the talks should be about five minutes long, with three minutes left after for questions. Or the posters should be 4 feet wide by 3 feet tall, etc.
|
|
| 5. |
|
NConduct the science conference! Have the science teams elect who from their group will give the oral presentations. Perhaps they will decide to give the talk as a group (this in not usually done in practice). Encourage the students to listen carefully during the talks and to ask questions about the work being reported on. During the poster session, have students rotate who will stand by their own poster and present it, while the others from their team mingle through the poster displays. Students should again think of what interests or confuses them about the posters they see from their colleagues and should be encouraged to ask lots of questions of the presenters.
|
- back to top -
Science Conference Handouts
- back to top -
The Science Conference handouts can be downloaded here:
- back to top -
Worksheets and Rubrics
- back to top -
The Session 4 Worksheets and Rubrics can be downloaded here:
- back to top -
|
|