Space Weather
From Physics World, July 2000
Space scientists are learning more about the phenomena underlying the magnetic storms and intense bursts of radiation that will bombard the Earth as the Sun reaches the most active period in the solar cycle
The following is an article by Janet Luhmann
Physics and Forecasts
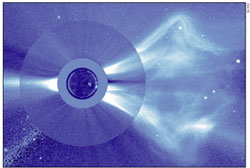
To the casual observer, the Sun may appear calm and unchanging. However, the behaviour and energy output of our nearest star varies according to a cycle that lasts 11 years or so. This behaviour has been followed for centuries by counting the number of sunspots - dark regions that appear and disappear on the visible solar "surface." The rise and fall in the number of sunspots - and the accompanying variations in solar activity - have attracted renewed attention recently as the Sun approaches a peak in its 11-year cycle. This interest has also been fuelled by spectacular images from spacecraft like the Solar and Heliospheric Observatory (SOHO).
 However, as we have become ever more reliant on space-based technology, including the global positioning system (GPS) for navigation and re-mote monitoring, we have also become more vulnerable to the major disturbances that solar activity can trigger.
The events that occurred at the height of activity during the two previous solar cycles altered our perception of so-called space weather. Some of the largest fluxes of solar radiation ever detected were measured in August 1972, in between the two Apollo lunar landings of that year.
If the blasts had occurred while astronauts had been on the Moon, they would have received a potentially lethal dose of radiation. Instead, one of the major telecommunications lines in the US failed briefly, and satellites in the popular geosynchronous orbit some 40,000 km above the Earth were exposed to energetic particles from the Sun that affected their solar-cell power systems.
More recently, during a magnetic storm in March 1989, transformers at power stations in Canada were affected by a current surge that was induced by the changing magnetic fields at ground level. The surge led to power blackouts throughout Quebec that lasted for several hours, and the power company lost more than 21 500 megawatts of its production capacity. In addition, a transformer at a nuclear-power plant in New Jersey was damaged beyond repair as a result of the induced current.
Geomagnetic observatories confirmed that these incidents were related to the occurrence of a major disturbance in space. As the new solar maximum approaches, we are re-minded that previous solar cycles proved that one or two extraordinary episodes usually occur during the cycle without notable fanfare.
Far-reaching effects
 So what is space weather? And what, if anything, can be done to forecast it and/or reduce its potentially harmful effects?
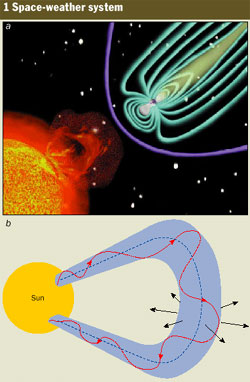
Space weather describes the conditions that prevail above the stratosphere - that is at altitudes of about 50 km and above - where responses to solar influences are particularly strong. The regions that are affected include the Earth's upper atmosphere and the ionosphere - the ionized region of the upper atmosphere that extends for a few hundred kilometres into space. The conditions also change the intensity of the radiation belts in the magnetosphere - the region beyond the ionosphere where electrons and ions are trapped by the Earth's magnetic field (figure 1).
Space weather is caused by the Sun's influence on the region of interplanetary space beyond the reach of the Earth's magnetic field. This region is filled with a stream of protons and electrons from the outer atmosphere of the Sun together with its magnetic field, which collectively form the solar wind.
Stormy space-weather conditions are usually inferred from deviations in the magnetic fields that are measured by satellites and ground-based instruments. These disturbances can also be deduced from conditions in the upper atmosphere and ionosphere, where intensified auroras and airglows are found. At higher altitudes the intensity of both electromagnetic and particle radiation increases, which can pose a hazard for astronauts and possibly even for aircrew travelling on high-altitude routes (see "Cosmic rays: an in-flight hazard?" by Denis O'Sullivan Physics World May 2000 p21).
In addition to power and communications failures on the ground, disturbed space weather increases the risk to space-craft on several counts. During stormy conditions, communication and weather satellites that reside on the outer edges of the radiation belt can suddenly find themselves in an environment that differs from the one for which they were originally designed.
The boost in the intensity of the electromagnetic radiation at extreme ultraviolet wavelengths heats the upper atmosphere and causes it to inflate. The resulting increase in the density of atmospheric gases at satellite altitudes can increase the atmospheric friction or drag on spacecraft, which can affect their orbit. In the 1970s the Skylab space station re-entered the Earth's atmosphere prematurely following a period of unexpectedly high solar activity. Indeed, this type of atmospheric drag is an ongoing concern with regard to the Hubble Space Telescope.
Furthermore, since signals to and from satellites are transmitted through the ionosphere, there is a far greater risk that instructions from a command centre will be affected during stormy space weather.
The performance of several expensive satellites, including the Intelstat and GOES-8 satellites in 1995 and Telesat in 1996, suffered briefly during or after a sequence of space-weather events. More seriously, one of the Telstar satellites was lost in 1997 following such an event
Learning from observation
Much is known about the phenomena that underlie space-weather disturbances thanks to research in solar and space physics, which routinely combines analyses and interpretations of solar, interplanetary and Earth-space observations. Indeed, an international constellation of satellites together with networks of ground-based aeronomy and solar observatories have joined forces to monitor and unravel the physics of space weather.
Among the satellites, SOHO, Yohkoh and the Transition Region and Coronal Explorer (TRACE) monitor the Sun. In addition, SOHO together with the Advanced Composition Explorer (ACE) and NASA's Wind satellite measure the inter-planetary environment near the Earth. Meanwhile, the state of the magnetosphere is monitored by the Polar, Interball and Geotail satellites as well as the Solar Anomalous Magnetospheric Particle Explorer (SAMPEX). And various satellites - including the Fast Auroral Snapshot satellite, the Student Nitric Oxide Explorer and those in the Defence Meteorological Satellite programme - probe the response and interactions of the upper atmosphere to what is happening above it.
Back on Earth, optical and radio telescopes at sites ranging from Learmouth in Australia to Kitt Peak in Arizona keep their instrumental eyes on the Sun. Meanwhile, aeronomy observatories in Alaska, Greenland and Sweden monitor the conditions in the upper atmosphere and ionosphere using radars, cameras and photometers designed for auroral observations. And magnetic-field observatories around the world provide "geomagnetic indices" that are used to measure the severity of space weather, in much the same way that the Richter scale is used to characterize earthquakes.
The magnetic or geomagnetic storms that dominate space weather during active solar periods are now widely recognized as being the response to a particular type of solar activity, known as Coronal Mass Ejections. This recognition is due, in part, to the publication of consciousness-raising re-ports by Jack Gosling of the Los Alamos National Laboratory in the 1990s.
 Coronal Mass Ejections (CMEs) came to light decades ago during observations of total solar eclipses. But the fleeting nature of these observations and qualitative documentation on them makes it difficult to know to whom the initial discovery should be credited.
The Sun's outer atmosphere, called the corona, is composed of highly ionized hydrogen and is normally invisible due to the blinding brightness of light from the photosphere, the apparent surface of the Sun. During a total solar eclipse, however, the corona becomes visible as white light from the photosphere is scattered by electrons in the outer atmosphere. Multiple ray-like structures are seen where the electron density is higher than average (see "Total solar eclipses: magic,science and wonder" by Francisco Diego Physics World August 1999 pp31-36). This structure changes with time and is at its most complex when the Sun is most active.
The structure of the corona is controlled by the Sun's changing magnetic field. The field is simple and approximately dipolar around the solar minimum but becomes dominated by higher-order harmonics around the sunspot maximum. These harmonics form many localized loops that are related to the active regions. Eclipse watchers might witness features resembling blobs or tongues of material that are probably Coronal Mass Ejections.
Solar features in detail
Detailed studies of the corona became possible following the invention of the coronagraph by the French astronomer Bernard Lyot in the 1930s. Lyot's instrument created false eclipses, which meant that observations of the corona could be made even when the Sun was not in eclipse. Later observations of both the coronal structure and what appeared to be coronal eruptions were confirmed and greatly improved thanks to the development of low-light-level imagers and space-based coronagraphs that are not affected by the Earth's light-scattering atmosphere.
The appearance of CMEs, together with the generally accepted coronal physics, suggests that the ejections are localized, large-scale changes in the corona. These changes involve the expulsion of material, mainly in the form of a proton-;electron plasma, that exceeds the normal level of plasma carried outward in the solar wind. Furthermore, the appearance of the eruptions suggests that twisted magnetic "loops," which expand outward into interplanetary space, are involved (figure 1b). The speeds of these loops have been measured from sequences of coronagraph images. The initial velocities range from tens of kilometres per second to around 2000 kms -1. In comparison, the typical speed of the solar wind is 350-400 kms -1.
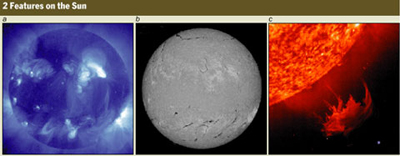
The eruptions are accompanied by bursts of radio waves and soft X-rays that last for several hours. The X-rays are thermal emissions from glowing "arcades," a series of loops formed from heated plasma (figure 2a). The relationship between these arcades and Coronal Mass Ejections is still under study. Visible light is also present in the arcade emissions but is too faint to be seen against the bright visible disk of the photosphere. Meanwhile, gyrating electrons that have been accelerated in the corona, or by the interaction between the CME and the solar wind, emit radio waves.
Elongated clouds of photospheric gas called "filaments" are another solar feature affected by Coronal Mass Ejections. Suspended above the bright photosphere, these features appear as dark areas in filtered images where only radiation from the hydrogen Lyman alpha line at 1215.7 Å is allowed to pass (figure 2b). Filaments observed near the limb or edge of the Sun are called prominences and are often seen to erupt at the same time as some Coronal Mass Ejections (figure 2c). Similarly, filaments often disappear when Coronal Mass Ejections erupt nearby. These observations suggest that changes occur in the magnetic fields that surround a filament during a Coronal Mass Ejection. Such changes destroy the balance of forces that keeps the clouds of gas aloft.
Flares are distinct, smaller-scale solar activities that energize the coronal plasma near complex groups of evolving sunspots or active regions. They are sometimes, though not always, associated with Coronal Mass Ejections. Although it is generally agreed that CMEs involve changes in the large-scale coronal magnetic fields, the exact physical causes of these phenomena remain a subject of intense investigation.
 The structure of the coronal magnetic field can be inferred from coronagraph images. Observations show that this magnetic field, together with the field of the underlying photo-sphere, evolves rapidly when the Sun is active and as new groups of sunspots emerge and disperse.
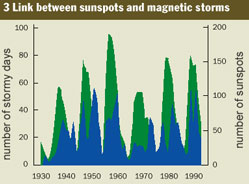
Coronal mass ejections occur on timescales ranging from a few per week, during times of low solar activity, to a few per day around the sunspot maximum. Only a fraction of the Coronal Mass Ejections seen on the Sun lead to interplanetary effects close to the Earth. However, the imprint of the solar cycle on the frequency of magnetic storms provides the first piece of evidence that sunspots, Coronal Mass Ejections and magnetic storms are all somehow related (figure 3).
Although the physics connecting sunspots and Coronal Mass Ejections is not completely understood in detail, it is at least based logically on common ties to the Sun's magnetic field.
The Earth-Sun Connection
But how do Coronal Mass Ejections lead to magnetic storms? The answer is in the disturbances they produce in interplanetary space. The interplanetary counterparts of Coronal Mass Ejections appear as large bubbles or helices of twisted magnetic fields a few million kilometres across, and these have been detected by spacecraft like SOHO, Wind and ACE. The bubbles and helices are still partially rooted at the Sun, which is consistent with the coronal picture. A few of these features move at speeds of 500-1500 kms -1 , which is faster than the normal solar wind. This creates a shock wave that accelerates a small fraction of the solar-wind particles to high energies ahead of the ejected cloud of plasma (figure 4).
The interaction between the solar wind and the Earth's dipolar field shapes the magnetosphere, compressing it on the side facing the Sun and stretching it for millions of kilometres on the other side (figure 1a). Its overall size and shape are determined primarily by the balance between the dynamic pressure of the solar wind and the pressure of Earth's magnetic field.
The compressed "nose" of the magnetosphere is normally located at around 64,000 km. But at times when the dynamic pressure of the solar wind is extraordinarily high, the edge of the magnetosphere can move inside the geosynchronous satellite orbit at 40 000 km, which can leave satellites exposed to interplanetary particles and fields.
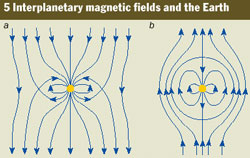
Meanwhile, the interplanetary magnetic field controls the transfer of solar-wind energy and momentum into the magnetosphere, as first explained by James Dungey of Imperial College, London, in 1961. Observations have clearly shown that the strength of the geomagnetic activity is largely dictated by the occurrence of interplanetary magnetic fields that point southward relative to the direction of the Earth's magnetic field. The southward interplanetary field opposes the Earth's magnetic field and allows the magnetic fields in inter-planetary space to connect to the fields in the magnetosphere (figure 5). Such "interconnection" does not occur as effectively for the northerly interplanetary fields.
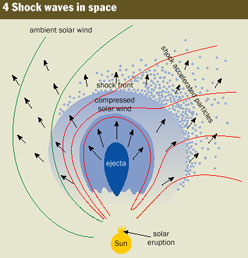 The particles that are accelerated by the shock reach the Earth ahead of the shock wave itself, and enter the magneto-sphere along the interconnected magnetic field lines. The initial increase in radiation at high latitudes is the first sign that a major magnetic storm is imminent (in spite of the large numbers of X-rays arriving from the Sun at the speed of light, photons are less reliable indicators of the approaching fast-moving ejecta).
The solar wind behind the shock wave is compressed by the ejected particles that move through it. This plug of dense solar wind pushes the nose of the magnetosphere closer to Earth. The embedded interplanetary magnetic field is also compressed and drapes around the ejected material. This draping produces interplanetary fields with stronger north-south orientations than usual, as does the twisted magnetic field inside the ejected plasma. Thus the stage is set for the interaction of the interplanetary disturbance with the magnetosphere - the key factor in producing a strong storm.
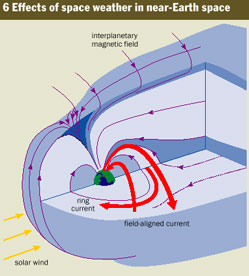
When a magnetic storm occurs, the electric field associated with the interplanetary field penetrates deep into the magnetosphere along the interconnected field lines. These electric fields drive convection currents within the plasma in the magnetosphere and the ionosphere at high latitudes (figure 6). Some of the electrons and ions are accelerated to higher energies and injected towards the Earth to form a "ring cur-rent," which reduces the magnetic field measured on the ground at mid and low latitudes - one of the hallmarks of a magnetic storm.
At the same time several physical processes related to the passage of the interplanetary disturbance increase the number and energy of particles in the radiation belts. A distorted version of the interplanetary shock wave propagates through the magnetosphere and accelerates some of the particles in the radiation belt. The disturbance excites magnetohydrodynamic waves in the magnetosphere and accelerates the electrons and ions even further. Meanwhile, some of the particles accelerated out of the solar-wind plasma by the interplanetary shock penetrate into the radiation belt, adding to the number of energetic particles.
The compression of the magnetosphere, together with particle scattering by the waves, dumps great numbers of particles into the upper atmosphere, particularly near the Northand South Poles, where the interconnected magnetic field lines converge. These particles then collide with gas molecules in the upper atmosphere, exciting them into a higher-energy state. The states de-excite by emitting radiation, thereby causing intense auroras. The ionosphere is disturbed further by the intense currents that flow through it, especially where it is made more conducting due to additional ionization by electrons and ions. The upper atmosphere in the polar regions heats and expands - behaviour that leads to large-scale atmospheric waves that are propelled from the Poles towards the equator.
So a magnetic storm is a complicated and multifaceted reaction to a Coronal Mass Ejection launched towards the Earth. Moreover, each storm has its own idiosyncrasies de-pending on the states of the magnetosphere and ionosphere, and the details of the interplanetary disturbance that reaches the Earth.
For example, the dense material that is associated with a disappearing filament on the Sun can arrive at Earth as a dense mass of helium-rich plasma following the main ejecta. The resulting incident dynamic pressure can temporarily increase tenfold, adding a late phase to the storm that com-presses the magnetosphere for a second time. "Superstorms" can also occur if two interplanetary disturbances interact with one another en route to the Earth.
Space-weather forecasts
Can magnetic storms be forecast? If so, how could the forecasts be used? Although space weather is a complex physical system, enough is now known to begin building sophisticated models to simulate magnetic storms and their effects.
 There are two basic types of models: empirical models and numerical simulations, and two basic philosophies. The first approach involves modelling near-Earth space based on a prescribed (or measured) interplanetary disturbance. An example of such an empirical model developed at Rice University in Houston characterizes the behaviour of the radiation belt and inner magnetosphere for specific levels of geomagnetic activity.
Meanwhile groups at Dartmouth College in the US, the University of California at Los Angeles and the University of Michigan have developed numerical models that simulate the magnetosphere using magnetohydrodynamic approximations. And researchers at University College, London, and the National Center for Atmospheric Research's High Altitude Observatory in Colorado have developed models of the atmosphere and ionosphere (see the space-physics Web site http://espsun.space.swri.edu/SPA for details).
The alternative "cradle to grave" approach involves modelling the complete system - from the Sun to the upper atmosphere-based on solar observations. However, such full-system models are still in the development stage. Both types of model require further improvements in physical understanding - and perhaps data-assimilation techniques - to improve their performance.
 Since interplanetary disturbances travel at speeds ranging from several hundred to a thousand kilometres per second, it is possible to give advance warning of solar storms. Models based on interplanetary information can forecast space weather about an hour in advance using real-time information from spacecraft like ACE, which is about 1,300,000 km away.
However, models based on solar observations can potentially provide forecasts several days in advance. Currently, the only such models that are used on a regular basis involve semi-empirical schemes to predict the arrival of the inter-planetary shock wave and solar-energetic particles. Perhaps the greatest barrier to long-term storm predictions is the lack of knowledge about Coronal Mass Ejections.
Many of the models under development are ultimately destined for use by organizations who will provide space-weather forecasts - such as the National Oceanic and Atmospheric Administration Space Environment Center in the US, the Hiraiso Solar Terrestrial Research Centre in Japan, IPS Radio and Space Services in Australia and the Lund Space Weather Centre in Sweden.
How will such forecasts be used? Many groups already take advantage of the space-weather forecasts that are currently issued. These include communications and power industries, geophysical surveyors who use magnetic-field measurement and the GPS system for resource prospecting and monitoring, national defence agencies, organizations that launch satellites, national and international space agencies, and radio enthusiasts. These users can also exploit the physics behind the phenomenology of space weather to design robust systems and procedures that are less affected during storms.
Most of the models are not yet ready for use during the solar maximum that is upon us, but the detailed observations made this year and next will provide the test cases and impetus for what is to come. Indeed, some of the largest space-weather events on record have occurred as the solar activity declined. Best of all, the framework of the models will reveal more of the intricate physics that makes up the connected Sun-Earth system and will broaden our horizons about our environment in space and our relationship with our own variable star.
Space Weather Applications
 Impact will monitor and predict local space weather disturbances. Should we be concerned about Solar Max? In this short interview, Impact Principal Investigator Dr. Janet Luhmann tells us how Solar Max affects us on Earth (4.16 MB, .mov).
Video Problems? Get the latest QuickTime plug-in here
Further reading
N Arnold 1999 Sun’s magnetic surprise Physics World June pp46–51
S Cowley 1995 Where the solar wind blows Physics World September pp21–22
J W Dungey 1961 Interplanetary magnetic field and the auroral zones Phys. Rev. Lett. 647
J T Gosling 1993 The solar flare myth J. Geophysical Res 98 18937
M G Kivelson and C T Russell 1995 Introduction to Space Physics (Cambridge University Press)
Exploratorium Solar Maximum Web page: http://www.exploratorium.edu/solarmax
US National Research Council Space Weather Research Web page http://www.nas.edu/ssb/cover.html


