|
RHESSI Scientists have created a
QuickLook
Webpage to browse through RHESSI data.
The Quicklook Browser allows one to view low resolution images of all solar flares
seen by RHESSI. For every flare there are several different images: a full Sun
image showing the location of the flare and then images for each of the different
energy channels that RHESSI observes. The images are annotated with tons of information
that is useful for scientists, but may prove somewhat confusing to the average
person.
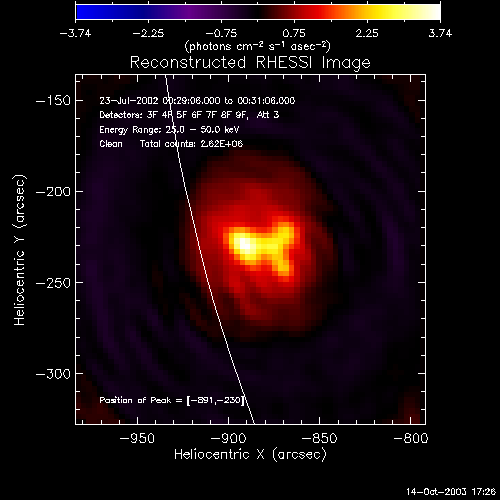
Pictured to the right is one such image. The colored bar across the top tells you what the colors in the image represent, which is essentially brightness: yellow colors are brighter than orange, etc. The coordinate system on the axes is angle on the sky in units of arcseconds. The center of the Sun is the origin of the coordinate system. In some of the images you will see a curved white line running through it. That represents the edge of the Sun, or its limb as scientist call it. The first line of text gives the date and time (Universal Time) of the observation. The second line tells which detectors aboard the spacecraft were used. The third line gives the energy range of light represented in the image. The units of energy given are in kilo-electronvolts (keV). |
|
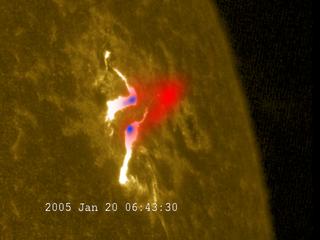 |
RHESSI and TRACE View of January 20, 2005 Solar Flare RHESSI spacecraft images of gamma-rays (blue) and X-rays (red) thrown off by the hottest part of the flare are shown with UV images from the TRACE spacecraft. The gamma rays are made by energetic protons at the Sun. Scientists were surprised that the gamma rays matched the energy spectrum of protons at Earth: the proton storm may have come directly from the Sun and not from the CME as anticipated. Movie with co-registered TRACE and RHESSI imagery
|
 |
First Flare movie for RHESSI An animation of an M-class flare viewed by RHESSI on February 20, 2002. Movie zoomed in on the RHESSI flare and played at 26x normal.
|
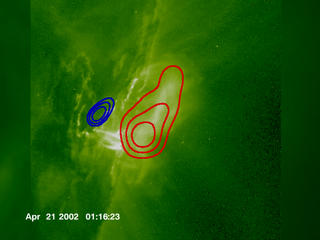 |
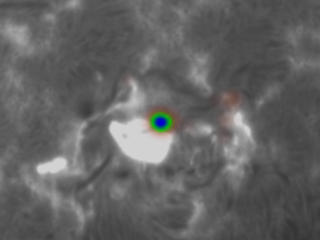
RHESSI Observes the Flare over AR9906
Zoom in to solar active region AR9906 on April 21, 2002 with SOHO/EIT, TRACE and RHESSI data. RHESSI observes x-rays from this flare. The red contours represent the 12-25 keV photon energy range and the blue contours represent 50-100 keV.
View the entire online movie |
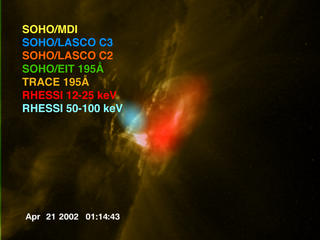 |
A Multi-Mission View of the AR9906 Solar Flare with Instrument Labels Here's a view of the Sun, from the point of view of a fleet of Sun-observing spacecraft - SOHO, TRACE, and RHESSI. The time scales of the data samples in this visualization range from 6 hours to as short as 12 seconds and the display rate varies throughout the movie. The region and event of interest is the solar flare over solar active region AR9906 on April 21, 2002. In this visualization, the instrument names appear in a color roughly matching the color used for the data, and black corresponds to no (current) instrument coverage.
View the entire online movie |
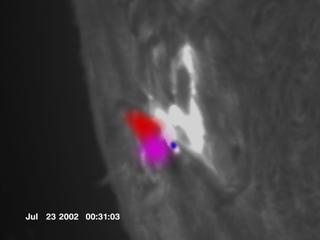 |
RHESSI Observes 2.2 MeV Line Emission from a Solar Flare The solar flare at Active Region AR 10039 on July 23, 2002 exhibits many exceptional high-energy phenomena including the 2.223 MeV neutron capture line and the 511 keV electron-positron (antimatter) annihilation line. In the animation, the RHESSI low-energy channels (12-25 keV) are represented in red and appears predominantly in coronal loops. The high-energy flux appears as blue at the footpoints of the coronal loops. Violet is used to indicate the location and relative intensity of the 2.2MeV emission.
View the entire online movie |
Last updated 02/01/2010 © UC Regents