Welcome!
This is an example of how you could learn how to use real scientific data from SID Space Weather Monitors to locate solar flares, other astronomical phenomena, and possible even electrical interference.
YOU NEED TO KNOW
- All times are given in Universal Time Why?
- Each place around the world that hosts a SID monitor has a short nickname, or unique ID, to indentify it. Examples are WSO, USU, Jaap, Germany-DLR, India-2, etc. On the graphs, sometimes these names are truncated. In most cases you cannot tell where in the world the monitor is located from its nickname. Sorry.
- If you are searching for solar flares, it is only data during the daytime that should interest you. (Can you figure out why?) So you need to be able to tell daytime from nighttime data. How?
- For the SID monitors to be able to track VLF (very low frequency) radio signals, somebody has to be transmitting those VLF signals. Tell me about them. Like radio stations, those transmitters each have separate call names. The ones we listen to are NAA, NML, and NLK.
Try our data browser http://sid.stanford.edu/database-browser/. It will open in a separate screen and you can follow along.
You can click on any image below to see it larger.
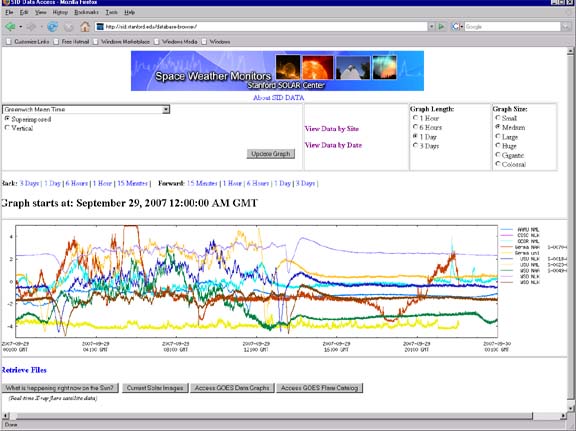
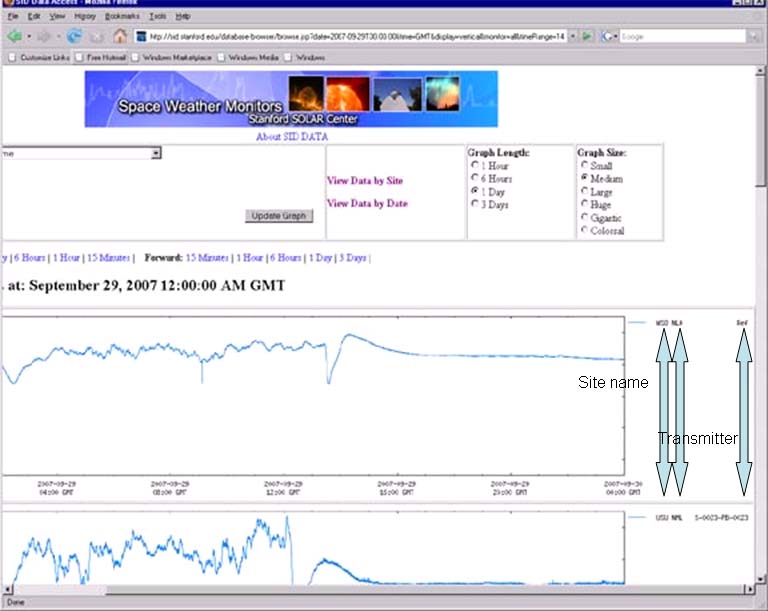
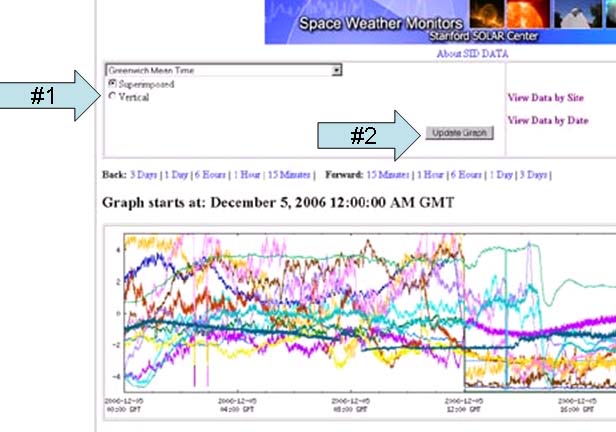
1. Here's what you see first: 2. Too confusing? Try this instead. Hit the Vertical radio button then the Update Graph button: Now you see separate graphs of SID data for each site. 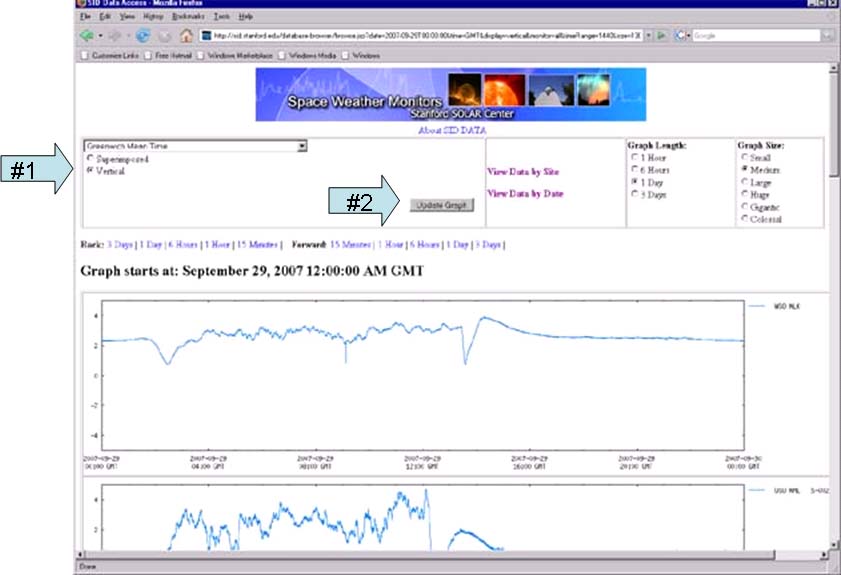
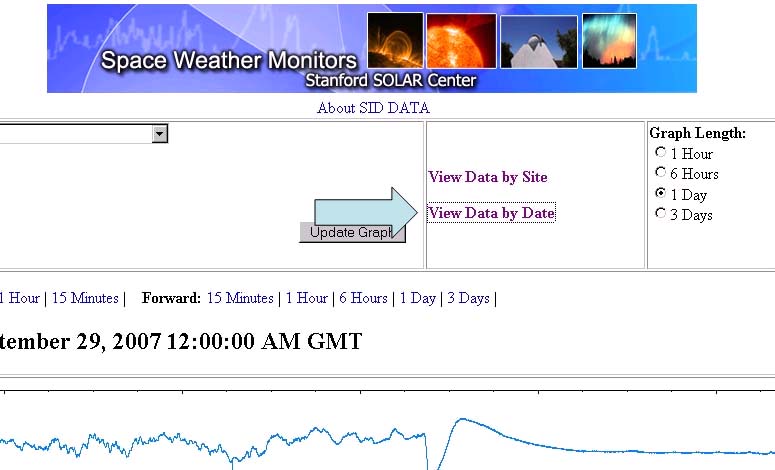
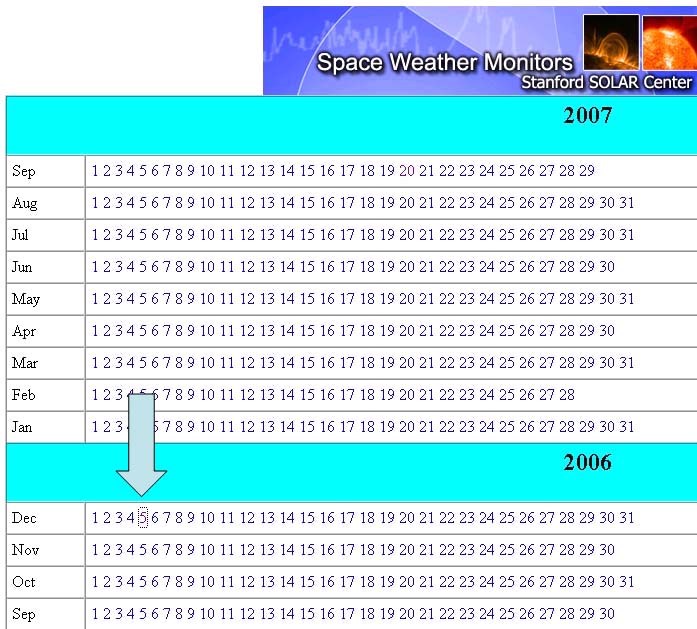
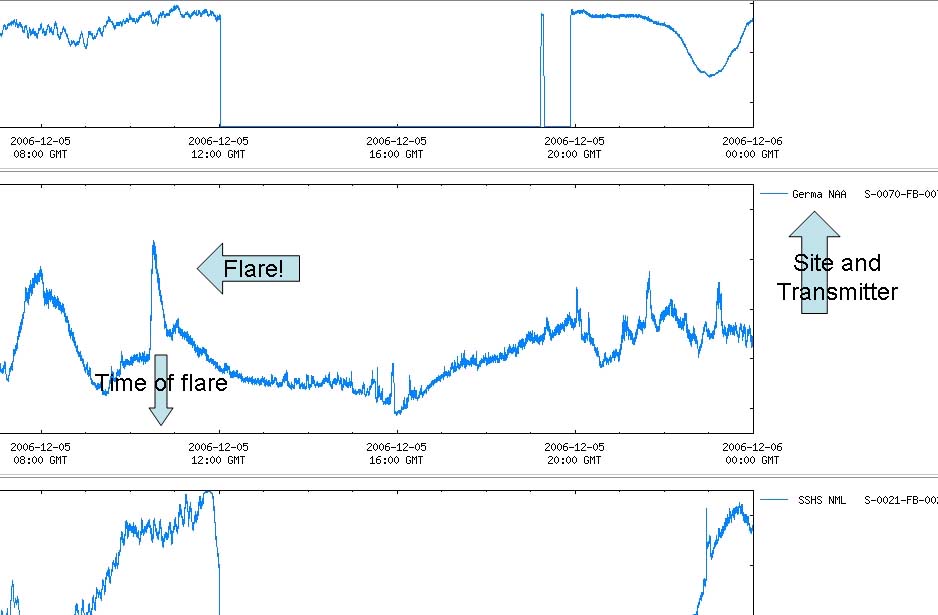
3. Use the scrollbar on the right to see all the graphs. Use the scrollbar along the bottom to see where you find the site name, the transitter, and the monitor name: 4. The tool will give you all the most recent data, usually yesterday's, unless you tell it something else. Let's pick a different date on which to look for a flare. Hit View Data by Date. 5. I happen to know there was a flare on 5 December 2006 around 11 AM UT. So let's pick that one. Click on December 5 2006. 6. Here's our 5 December 2006 data. To read it more easily, separate the lines on the graph just as you did before: (Hit Vertical then Update Graph)
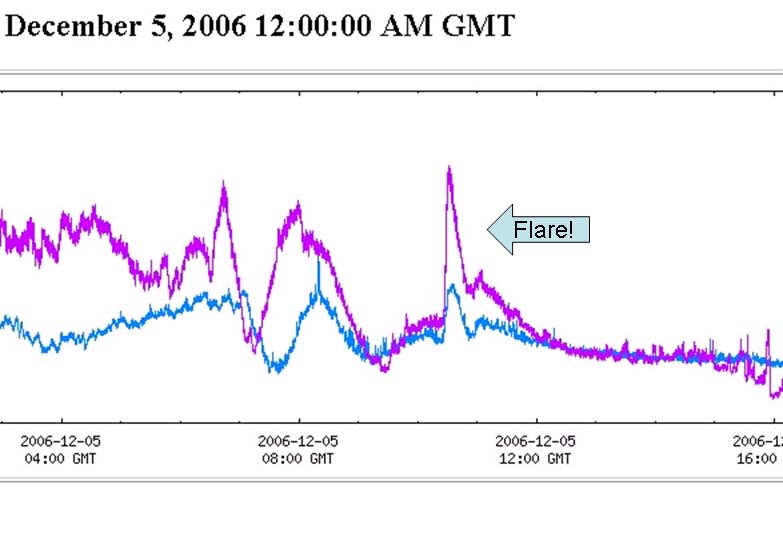
7. This is easier to read! Now, using the scrollbar down the right side, look at all the graphs and see if you notice a peak (or dip) in the data around 11:00 GMT? 8. A little before 12:00 GMT time on 5 December, some of the graphs show what looks like a flare. Not all sites will have picked it up because it might have been nighttime at their site, or their monitors were turned off, or not tuned properly. When you find one that shows the flare, use the bottom scrollbar to move over to see the name of the site and transmitter. 9. Write down the names of the sites and transmitters that appeared to have picked up the flare. I found 2: Germany-DLR NAA and Jaap NAA. How many did you find? 10. To make it easier for myself, I looked again at the graphs that showed the flare. This time I used the View Data By Site, then checked the names of the sites I had picked, then I hit Show Calendar and pick 5 December again. There's our flare! 11. Sometimes flares are hard to tell from noise and electrical interence. Here are some Examples to help distinguish flares in the data
Congratulations -- You have completed our flare search example!
Go on to Step 3