|
Everyone who completes this activity and sends us a report will receive a certificate acknowledging your contributions to World Space Week!
Background
The
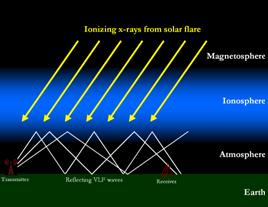
Sun spews out a constant stream of X-ray and extreme ultraviolet (EUV)
radiation. This energy, along with that from cosmic rays, affects the
Earth’s ionosphere, starting some 60 km above us. When solar energy
or cosmic rays strike the ionosphere, electrons
are stripped from their nuclei. This process is called ionizing, hence
the name ionosphere. It is the free electrons in the ionosphere that have
a strong influence on the propagation of radio signals. Radio frequencies
of very long wavelength (very low frequency or “VLF”) “bounce”
or reflect off these free electrons in the ionosphere thus, conveniently
for us, allowing radio communication over the horizon and around our curved
Earth. The strength of the received radio signal changes according to
how much ionization has occurred and from which level of the ionosphere
the VLF wave has “bounced.”
The ionosphere has several layers created at different altitudes and made up of different densities of ionization. Each layer has its own properties, and the existence and number of layers change daily under the influence of the Sun. During the day, the ionosphere is heavily ionized by the Sun. During the night hours the cosmic rays dominate because there is no ionization caused by the Sun (which has set below the horizon). Thus there is a daily cycle associated with the ionizations. In addition to the
daily fluctuations, activity on the Sun can cause dramatic sudden changes
to the ionosphere. The Sun can unexpectedly erupt with a
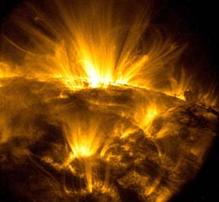
solar flare,
a violent explosion in the Sun's
atmosphere caused by huge magnetic activity. These sudden flares produce
large amounts of X-rays and EUV energy, which travel to the Earth (and
other planets) at the speed of light.
The biggest flare ever recorded on the Sun When the energy from a solar flare or other disturbance reaches the Earth, the ionosphere becomes suddenly more ionized, thus changing the density and location of its layers. Hence the term “Sudden Ionospheric Disturbance” (SID) to describe the changes we are monitoring and also the nickname of our space weather monitoring instrument, SID. Read more about how the Sun affects the Earth Read more about our ionosphere Watch more videos of the Sun's super flare!
Find potential flares or other
events in our SID Space Weather Monitor data
Write down the date and time of the flare you would like to find.
If you'd like, you can start a
Solar Flare Event Report for us!
Solar SID data are easy to understand and somewhat similar to those from
a seismograph. Look at the graph below: the horizontal axis represents time,
in this case about 24 hours. The vertical axis represents strength of
the VLF signal being received. (The actual measured values of this aren’t
important, only the amount of change.) As you learned above, the strength
of the VLF signal changes depending upon the ionization of the Earth’s
ionosphere, and that depends upon what is going on on the Sun!
Solar flares, and sometimes other astronomical events,
show up on SID data as spikes above (or occasionally
below) the normal signal strength level. Four solar flares are labeled
on the data graph below.
Finding flares in the data is the most important part of this activity. Once you find a flare, the rest is easy! Now, with the date and time of your flare written down, you can go to the SID database to see if any of the monitors picked up your flare: If the SID data shows your flare, you can start a Flare Report Form You'll eventually send it to us, and receive a certificate acknowledging your scientific find! If you couldn't find your flare in the SID database, it may have occurred when most of the monitors were in nighttime. Pick a different flare from the catalog and try again.
On the website above, set the date and time to cover the day of your flare just as you did when you picked that flare. Then hit the GO GOES button. Our example shows 5 December 2006, the date of the flare we used. 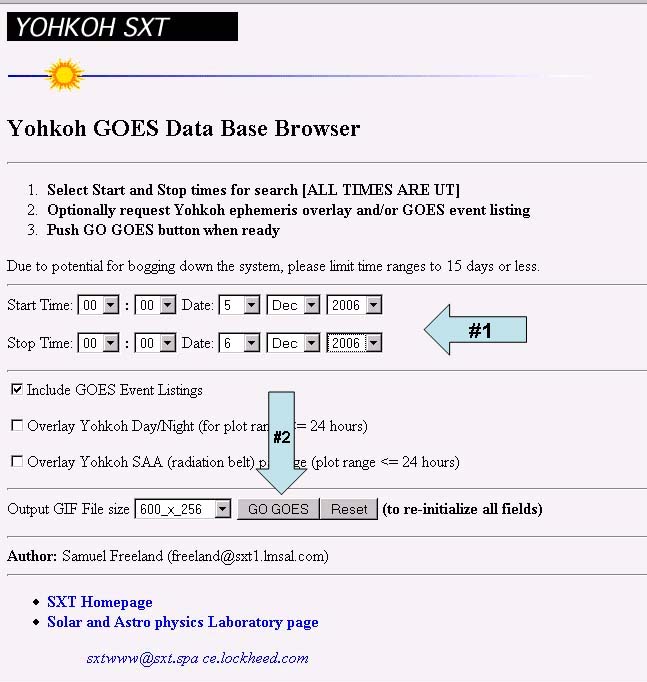
Click for larger imnage Find your flare on the graph and the list. The page shows that the X-ray flare on 5 December was an X.9.0, a really big one!!! 
Click for larger imnage Write down your flare's strength on the Flare Report Form. Also write down the number of the "Active Region", that's the number in the AR# rightmost column. In our example above, the AR# is 930. The number for your flare will be different. You'll need this number for the next step.
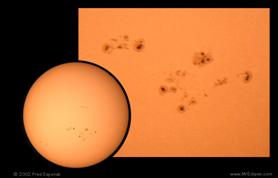
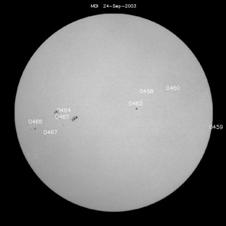
Trace your flare back to the Sun Active regions are places on the visible surface of the Sun containing strong magnetic fields in complex configurations and usually in a constant state of change and flux. Active regions are often associated with sunspots. They are most often the source of the solar flares you have detected.
Active regions
are given consecutive numbers by scientists as they appear on the Sun's disk.
If you have detected a flare and want to know where on the Sun it came
from, you'dd need to use the AR# number you got from Step #5 above.
With the time and region number of a flare, you can see a picture of
the active region on the Sun itself!
Go to http://sohowww.nascom.nasa.gov/sunspots/.
The current day’s
solar active regions will be shown there. If the disk is blank, there
are no active regions for that day. Since you will need to check for previous
days’ images for your flare, hit the “List of all available daily images”
near the bottom of that page. It will take you to
http://sohowww.nascom.nasa.gov/data/synoptic/sunspots_earth/ Scan down the list for the date closest to the date of your flare. Click on that hotlink
and you should see a picture of the Sun's active regions for that time. Below is
an example.
Learn how to do this by reading below.
Learning
the history of your flare’s active region Starting
at the
website above that showed your flare's Active Region,
you can trace the history of your active
region.
Click on different images to
work your way back in time until your find the region just appearing on the left-hand side
if the Sun.
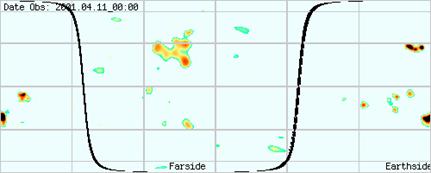
Sometimes you will see the region forming while you search back.
However, if it appears from over the Sun’s eastern (left side) limb, then you can
look for it on the farside, or back
side, of the Sun. You’ve find images at: http://soi.stanford.edu/data/full_farside/ It will take you a
little while to understand how to read these images, but the webpage gives
you some help. And it’s worth the effort when you discover your
active region first appearing on the far side of the Sun!
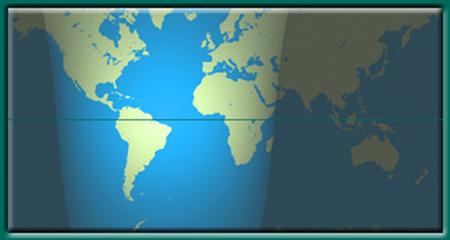
If this map confuses you, here's an equivalent picture of the Earth.
Click on the image to watch a movie of how day and night change on the Earth.
The farside images work the same way, although the back side of the Sun is
not dark like the backside of the Earth!
 Click to see video Earth image courtesy US Navy. Video and farside images courtesy of Philip Scherrer, Stanford University. If you find your Active Region appearing in a farside image, write down the date of that image on your Flare Report Form. If you can't find the region appearing, don't worry. Sometimes they do not show up on the maps.
Sometimes a flare will show up in the GOES data graphs but not the catalog. The GOES data is reduced by hand, and often flares are "missed" being added, or they are determined for some reason not to be included in the catalog. If you find flare signatures in your SID data, and if those flares also appear on the GOES graphs, but they are not listed in the catalog, then you may have found flares overlooked or ignored by the GOES cataloger. We would LOVE to hear about that! Please submit a Flare Report Form tell us in the comments section that your flare did not appear in the GOES catalog. Remember that the GOES satellites are detecting solar flares as they are emitted from the Sun. Your SID monitor is detecting changes to the Earth’s ionosphere caused by those same flares. So while your monitor and the satellites are tracking different effects, they are based on the same phenomena.
|