Welcome to Rainbows and Spectra!
Level 1: Picturing Light's Colors
|
|
Good day, I am Matasaburou. I am an
astronomer, a person who studies the stars and other things in the space.
I was born in Japan in 1652 C.E. At the age of twelve,
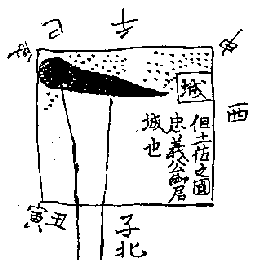
I was already observing the stars . Here is a picture I drew of a comet I observed, which I call "The
Tiger Tail Star". I will be your first guide in this light activity.
I'd like to show you a few things that astronomers do.
Do you think that you could be an astronomer? By doing the activities here, you will be learning some of the skills
astronomers use.
Light is important to astronomers. By studying the light that comes from stars, astronomers can learn many interesting things. They can tell if a star is a White Dwarf or a Red Giant by studying its light. They can also tell what a star is made of, how old it is, and how long its "life" will be.
Astronomers collect light using telescopes, and measure how bright the light is, or how much they see of different colors. Instead of just writing down what they find with words and numbers, scientists often put their measurements into a graph. A graph is a picture that shows information, usually several kinds of information. How can it do that? Well, sometimes a picture is easier to look at than words and numbers. You might say that one picture is worth a thousand of them!
To help you learn about graphs, we have prepared some graphing activities for you. Sorting out the different colors is a very important part of what astronomers do with light. To begin with, we're going to use pictures of objects for our graphs, but like light, they come in many colors.
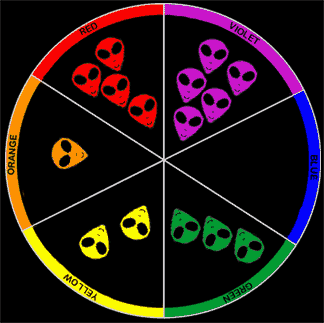
Below, I've put pictures of aliens on a color wheel to show how many aliens there are of each color.

Count the number of aliens of each color. Pretty easy, right? But think how long it would take if we had a hundred aliens!
You might want to remember the numbers or right them down for now. Also, write the answer to these questions in your notebook:
What does the pie chart tell you with words?
What else can you find out from the chart? How?
On the next page you will see another way to graph the very same thing, which shows you "how many" of each color instantly. Do you have an idea what this might look like? Click Next to find out.


