Histograms of  Spectra: Page 3.4 
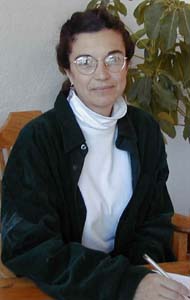
Hola!  My name is Patricia Carral.  I'm an astronomer and teacher from Los Estados Unidos de Mexico.  I live in Mexico with my husband and young son. I may not be famous, but there are many more like me, in universities and observatories around the world. We make important contributions to astronomy, and we love what we do! I study stars and galaxies that emit radio waves.   Did you know that radio waves are a kind of light too?  We make histograms of radio spectra just the way other astronomers do with visible light.

I hear you've been studying spectra and histograms of different light sources.  I have a task for you that is about learning what a source is made of.  I want you  make the histograms for some new sources, based on  the sources you've studied so far.  

(By the way, astronomers generally use the word spectrum to talk about both the separated light and the histogram that represents this.  We'll start doing this now.)

To Do: Experiment with adjusting each of the color cards below to the intensity you want. You may have to use the scroll bar at the bottom of the window to get some of the color cards on the screen. The graph below will show you the different intensities of color that you have chosen. Re-create some of the histograms for sources you've already studied, using your notes on the color intensities.


Next: You remember we've looked at the histograms for some elements, like hydrogen, helium and iron. Try to answer these questions, using the source-maker to help you make histograms for these sources.  Here is a page with all the sources you've studied, plus one new one: Carbon. This is to help you if you need to look up the intensity numbers for each color in each source.

  1. What would the histogram for fluorescent light look like if the source was twice as bright?
  2. What would the histogram look like for a source with equal amounts of hydrogen and helium?  Can you create such a source?  
  3. What if the source had only half as much helium as hydrogen?

Observe and Record:  Draw and describe your results in your notebook. Compare your sources with others and see if they can guess your sources.

Final Exam: Make model spectra for other sources that contain the elements you've seen.  You must perform arithmetic operations on some of the spectra to keep the intensities within the 0­20 limits of our simulator.  Round all numbers to the nearest integer, and treat any negative number as 0.  Write down all your color intensities.

  1. Hydrogen + 1/2 Helium  through green glass
  2. Helium + 1/2Hydrogen + 1/4Carbon
  3. Incandescent light - Helium
  4. Carbon source through amber glass (careful! this is tricky)
  5. You create a source.  Record its spectrum, what it is made of, and whether you used a glass filter. You can multiply and divide any spectrum, but you must make the same operation on each color!

Try to make a picture of each spectrum, either by doing a "screen dump"  of your source to a printer, or drawing the histogram in color on graph paper.  Can others identify them?

By  now you have mastered several basic concepts of working with light that are used in astronomy, and in other sciences as well. Together these techniques are known as spectroscopy.

If you go on to the next section, you'll find out about other types of light besides the visible.