|
|
|
|
| RHESSI Data |
|
RHESSI observed solar flares by recording an increase in the number of high energy photons from the Sun with its detectors.
One of the great things about RHESSI is that its detectors had excellent energy resolution. That is, RHESSI's 9 Germanium detectors were able to distinguish between photons of different energies, even when the energy difference was not very large.
The graph below, and the images on the next page, were generated from simulated RHESSI data. Scientists used simulated data to develop and test software so that everything is ready to go once the satellite is launched and actual data is received. Below, the number of detected photons is indicated by the vertical axis. The horizontal axis is time. The graph shows that between the time of 16:37:24 and 16:37:40 the detectors measured an increase in energetic photons.
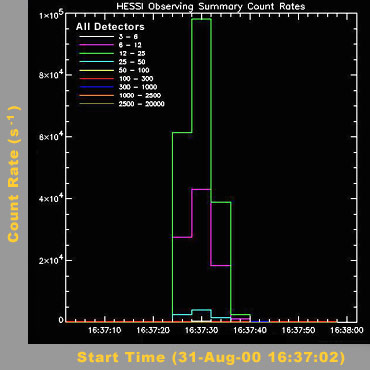
In this graph photons of different energy are represented by lines of different color. Lower energy photons are shown in white (energy of 3-6 keV) and higher energy photons (2.5 - 20 MeV) are shown in olive green. The chart in the upper left corner of the graph shows the different energy ranges measured in thousands of electronvolts, or kiloelectronvolts (keV) for short. As you can see, the detectors recorded the most photons in the 12-25 keV energy range for this flare.The next page will display other ways to view RHESSI flare data.
Last updated 02/01/2010 © UC Regents