The
Seasons demo version consists of a main screen, three parameter-setting
screens, six explanation screens and a logbook screen. All
but the explanation screens can be reached from the navigation
buttons at the top of each screen.
Main Screen
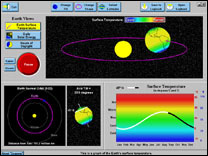
The Main Screen is where your students
will observe the results of their experiments.
At the top of the screen are navigation buttons that allow
your students to move to other screens and choose the axis
tilt, orbit shape, and latitude(s) they desire.
Two other buttons allow students to save
their experiment to the Logbook or to
open the Logbook to review past experiments.
The Main Screen presents a picture of
the Earth rotating about its axis and
revolving about the Sun. Note that this
depiction is not to scale and the Earth
as depicted here does not rotate 365
times per year. However, the tilt of
the axis and the relative speed of the
Earth
in its orbit around the Sun are to scale.
The lower left portion of the screen
shows the orbit shape and the axis tilt
that are selected. The orbit shape diagram
shows a continually updating distance
of the Earth from the Sun. The
orbits of Venus and Mars are included
for spatial perspective.
The controls on the upper left panel
allow your students to choose the output
variable they wish to view. They may
look at the Earth's surface temperature,
the
(average) daily solar energy, or the
hours of daylight. The annual cycle of
the selected variable and the latitude(s)
they choose (one or two at a time) is
(are) depicted on the graph in the lower
right panel.
Page 2 of 4 |
|
|