|
INTRODUCTION
MAGNETIC FIELDS
CMES AND FLARES
MAGNETIC MODELING
FORECASTERS
HOME
|
Magnetic Cycles on the Sun
Image Credit: SOHO
|
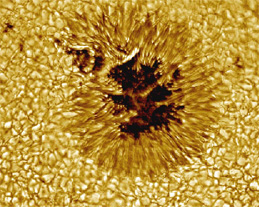 Image Credit: Vacuum Tower Telescope, NSA, NOAO
|
|
|
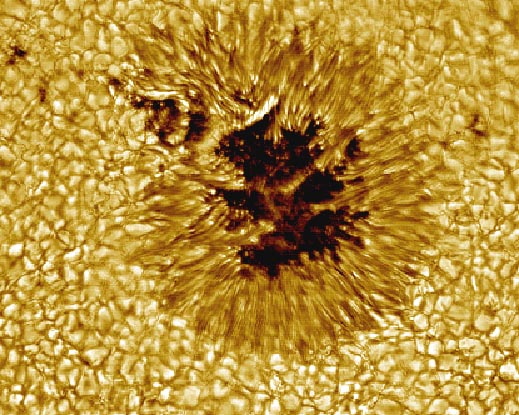
Sunspots, which are visible as dark regions in the photosphere, are areas of
high magnetic field. Several sunspot groups are visible above in the image
on the left (above). The above right picture is a close up of a sunspot in which you can
see the umbra (the dark, cooler, inner part of the sunspot) and the penunbra,
the lighter region which surrounds the umbra. Different sunspots have different
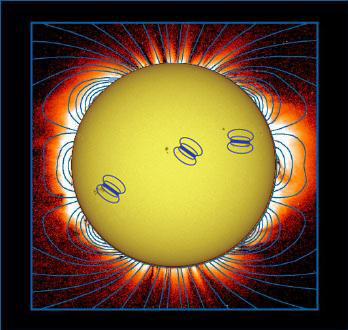
magnetic polarities just like the ends of a bar magnet. When sunspots appear in
pairs or groups their magnetic field structure looks much like little bar
magnets on the surface of the Sun (left). The Sun also has a global magnetic field
which on a large scale resembles that of a large bar magnet. Overall, the
Sun's complicated magnetic field is represented by the global field as well
as the sunspot fields, or "active regions" which are made up of several spots.
Scientists can gain insight to the Sun's magnetic field by studying patterns
in the always changing solar activity level.
|
|
Detailed records of sunspot numbers go back hundreds and hundreds of years.
When one is fortunate enough to have data over a long period of time it is
interesting to look for patterns in that data. The image to the right shows
sunspot numbers since 1980, can you see a pattern? Click on the image to see
a record of sunspot numbers since 1750!
|
|
Image Credit: NASA/MSFC/YOHKOH
|
As you may have noticed, the number of sunspots rises and falls in an 11 yea
pattern.The most recent solar maximum occurred in the summer of 2000. Scientists
are able to predict when the next solar maximum and minimum will occur quite accurately.
In the image to the left the smooth curves show the sunspot number prediction while the
jagged line indicates the actual measurements.
Click on the image for the most recent measurements.
|
|
Detailed records of sunspot numbers go back hundreds and hundreds of years.
When one is fortunate enough to have data over a long period of time it is
interesting to look for patterns in that data. The image to the right shows
sunspot numbers since 1980, can you see a pattern? Click on the image to see
a record of sunspot numbers since 1750!
|
Image Credit: NASA/MSFC
|
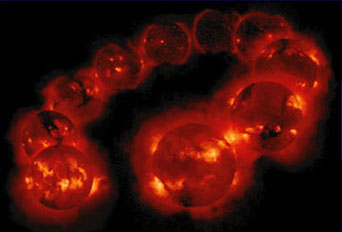
Image Credit: Lockheed Martin Solar & Astrophysics Lab

Image Credit: Lockheed Martin Solar & Astrophysics Lab
|
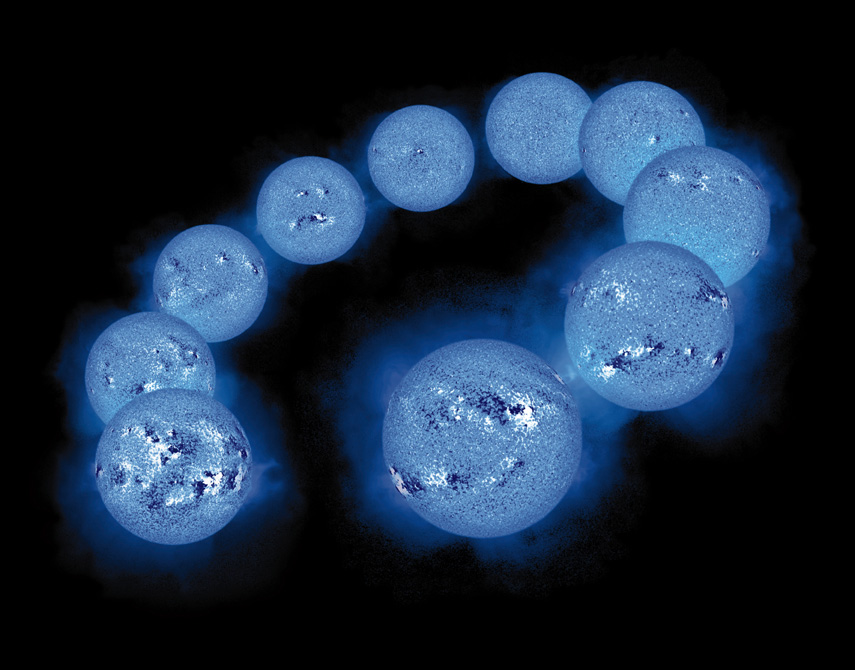
In general the Sun goes through an 11 year activity cycle. During solar minimum the
number of sunspots and signs of solar activity like coronal x-ray emissions, are
relatively low. Five or six years later solar maximum is reached. During solar maximum
there are a large number of sunspots (many of which cluster in "active regions"),
flares, glowing coronal arcades above sunspot active regions, and coronal eruptions are frequent.
All of the changes in the Sun during the solar cycle are related to changes in its magnetic
field. The top picture shows x-ray emission from the solar corona in a snapshot
taken every year from 1991 to 2000. The picture on the bottom is made from magnetic field
images of the Sun for the same time period and shows the rise and fall of magnetic field
intensity and polarity on the Sun. Notice that the darkest and lightest regions, where the
magnetic fields are strongest in the sunspot active regions (white is field pointing towards
you, black points back toward the Sun, gray is weak "mixed" polarity field), is also where
the coronal x-ray arcades glow most brightly. Not only does magnetic activity rise and
fall during the solar cycle, but the Sun's polar magnetic field also flips polarity every
11 years! The connection between the sunspot fields and the Sun's polar fields, known as
a "dynamo" process, is still a subject of solar physics research.
Click on each image to enlarge.
|
PAGE:
1
2
3
4
5
|