 |
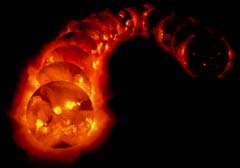
| This image
is comprised of 12 X-ray images of the Sun's atmosphere
taken between 1991 and 1995 in 120-day increments.
This composite image clearly demonstrates how
the Sun changes during the solar cycle. |
|
Scientists became aware that the Sun went
through cycles and changes by observing sunspots, the darker,
relatively cooler areas of the Sun. The number of sunspots
can be an indication of the degree of solar activity. The
average number of visible sunspots varies over time, increasing
and decreasing on a regular cycle of between 9.5 to 11 years,
on average about 10.8 years. An amateur astronomer, Heinrich
Schwabe, was the first to note this cycle in 1843. The part
of the cycle with low sunspot activity is referred to as "solar
minimum," the portion with high activity is known as
"solar maximum." The year 2000, was the last solar
maximum for the current solar cycle.
Solar Flares and CMEs
While sunspots have been used
historically to indicate levels of solar activity, other
solar features increase in number and intensity along with
the fluctuations in the Sun's magnetic field structure.
Coronal mass ejections (CMEs) and emissions of high-energy
solar flares become more common and more intense during
the period of solar maximum. This increase in solar activity
can affect us here on Earth (and in Earth's orbit) by what
is known as space weather.
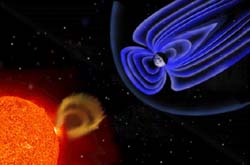 |
| This
NASA illustration shows the Earth's magnetosphere
and its interaction with the Sun. (Please note
this illustration is not to scale.) |
|
Effects on Earth
The Earth's own magnetic field
protects it from most of the direct effects of the Sun's
particle emissions, including the solar wind. But during
periods of intense solar activity geomagnetic storms can
produce heightened, spectacular displays of the Aurora Borealis
and Aurora Australis, known as the Northern and Southern
Lights. Geomagnetic storms can also disrupt radio transmissions
and affect power grids. Energetic electromagnetic bombardments
can interfere with the transmission of radio waves and the
flow of electric current in wires. Radio operators are familiar
with solar maximum and have to deal with an increase in
static on the airwaves. Occasionally, radio signals can
be completely drowned out by interference from solar radio
noise. Power grids can be overloaded by these same bombardments.
In 1989, during the last solar maximum, the power grid that
supplies Canada's Quebec province was knocked out by a geomagnetic
storm.
Satellite Disruption
Satellite operators may have
trouble locating and communicating with spacecraft through
the screen of the disturbed ionosphere. Users of GPS (Global
Positioning Satellites) and other satellite-based navigation
aids may find the errors in their position estimates significantly
increased. Since satellites are outside the protection of
the Earth's atmosphere, they are particularly vulnerable
to the severe geomagnetic storms that can result from solar
activity. Satellites can be damaged by exposure to the increased
electromagnetic radiation from the active Sun, as well as
energetic particle radiation from either solar activity
sources (flares or CMEs) or the enhanced Van Allen belts
resulting from geomagnetic storms. Their surfaces can also
experience damaging discharges.
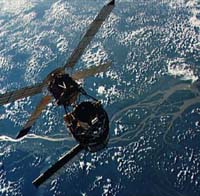 |
| "Satellite
drag" caused by the previous solar max, helped
bring down Skylab early. |
|
In addition to these polarity
changes which can damage sensitive electronics in satellites,
the increased solar emission also causes the Earth's atmosphere
to "puff out," creating increased drag on orbiting
satellites. This increased drag can cause satellite orbits
to decay more rapidly than predicted. The 100+ ton Skylab
station is a good example. Launched in 1973, the station
was supposed to remain in orbit until the 1980s. The purpose
of Skylab was, among other things, to study the Sun. Ironically,
due to increased solar activity, Skylab re-entered Earth's
atmosphere in 1979—raining debris over the Indian Ocean
and parts of Western Australia.
Solar Max 2000-2001 and Future
Maxima
Scientists still don't
completely understand all of the aspects of the solar cycle
and it's difficult to predict just how strong each solar
maximum will be. The 22 solar cycles studied since the one
Heinrich Schwabe noted in 1843 have varied in intensity.
This current solar cycle, #23, has been the most closely
observed ever. There are nearly one dozen space-based observatories
watching the Sun during this solar cycle.
 Find out more about Solar Maximum at the Solar
Max 2000 Web site.
Find out more about Solar Maximum at the Solar
Max 2000 Web site.
Story
courtesy of The Exploratorium ©2002 - www.exploratorium.edu
Images courtesy of NASA.
|