|
|
|||||
|
You Are The Scientist |
|
||||
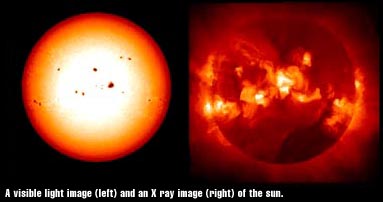
| What don't we know? As stellar physicist David Dearborn notes, "Scientists love mysteries. When you solve something, then it becomes a lot less interesting, and you go find another question to ask." YOU can contribute to Solar science research by doing the activity in this section. Read on to find out how. Scientists look at images of different types of light from the sun to unravel the mysteries of sunspots and Solar activity. The images may look very different, so researchers often compare images from the same time to look for a connection. In this activity, you will compare visible light images of sunspots with images that show active x-ray emitting regions for the same time. |
What can we see? Astronomer George Fisher explains in the RealMedia interview below that in the white-light images, what you see is the size of sunspots, and their arrangement on the solar disk. When you look at the sun's x-rays, basically you see how much energy is being released in the coronal magnetic field above the hot active regions. |
|
||
| He believes the amount of energy released as coronal x-rays is probably related to the total amount of magnetic field in the sunspots at the surface. | |||
| Questions scientists are asking: Will the x-ray images of the sun show more hot regions releasing energy when there are more sunspots? Will the hot x-rays and sunspots be at the same places on the disk? How will the area covered by x-ray active areas compare to the area covered by the sunspots? Will that relationship always be the same? |
||
|
Scientists are still uncertain about this, though many suspect the areas of sunspots and X-ray activity are related. According to Fisher, "Even though it's known that the area of sunspots group is roughly proportional to the amount of x-rays coming out of an active region, no one, as far as I know, has actually measured them." | |
| How? Like Galileo, you will measure the size of sunspots in visible-light. But you'll also have something that Galileo never dreamed of: x-ray images taken on the same day! These images are obtained from Yohkoh, a Japanese satellite launched in cooperation with NASA, and specially designed to observe the sun. You'll use an interactive program written in the language Java to measure areas of sunspots or x-ray activity on each image by "painting" in the areas with the mouse. You'll have images for each day in one month at the peak of a Solar activity cycle. Go on to the next page to start your investigation! |
|
|
|||||
|
|
|||||
|
©Copyright 2001 Regents of the University of California. |