| 6.2 More About Stellar Spectra |
|
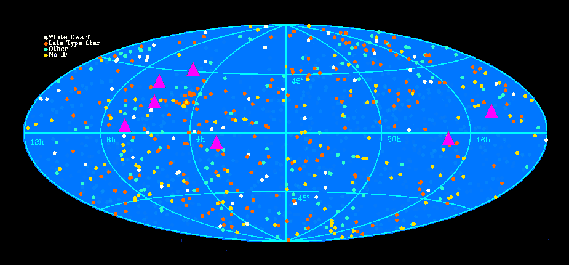
This sky map represents a complete sky survey of objects emitting extreme ultraviolet radiation, made by the EUVE satellite. The pink triangles represent the stars I need to have analyzed. To help you, I'm going to give you some spectra that have known emission and absorption lines of some elements marked. I'd like you to look at them carefully, first. Take a look at the spectra for the star Alpha Centauri. It will appear in a pop-up window over this window. Do you see the notations at the top of some of the peaks in the spectrum? These mark where lines of elements in various states of ionization have been identified. The letters in these notations identify the element, the Roman numerals identify the state of ionization of the element, and the numbers identify the frequency of the peak. Take a look at the periodic table which will appear in a pop-up window over the browser. What elements have been identified in Alpha Centauri's spectrum? Look also at the spectrum for Sigma2 Coronae Borealis. Identify some of the elements and their states of ionization. Refer to the periodic table if you need to. Most of the elements in a star's spectrum are the elements within the star itself. Next you will analyze the newly recorded star spectra from EUVE. |
Copyright ©1996-2001 Regents of the University of California


