


UNDER CONSTRUCTIONLesson Plan: Making your own 3-D EUVE All-Sky Survey Map | |
Teacher InformationLearning Objectives:1. Students will apply lessons learned in "How Satellites See" lesson such as identifying cellestial sources in satellite data and comparing various satellite output (though this time of a single satellite) 2. Students will obtain a three-dimensional understanding of satellite data.
General Subject Areas: Best For Grades: Middle School
Student Prerequisites:
Time Requirements:
Materials Required:
|
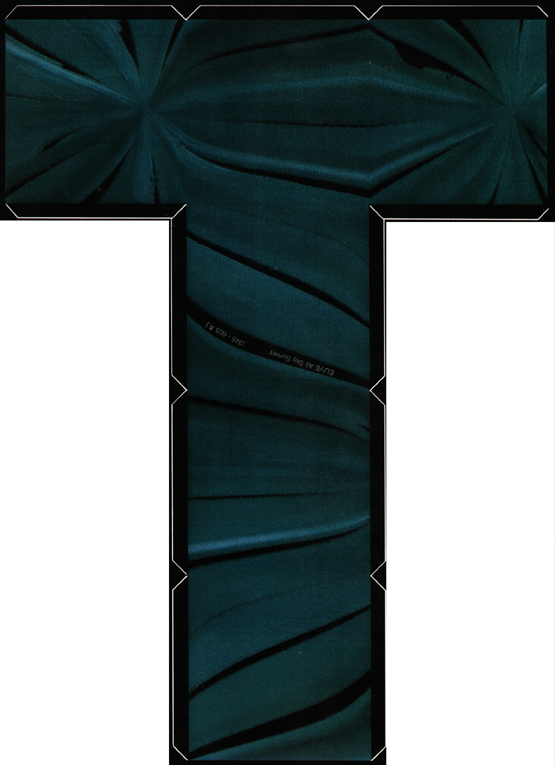
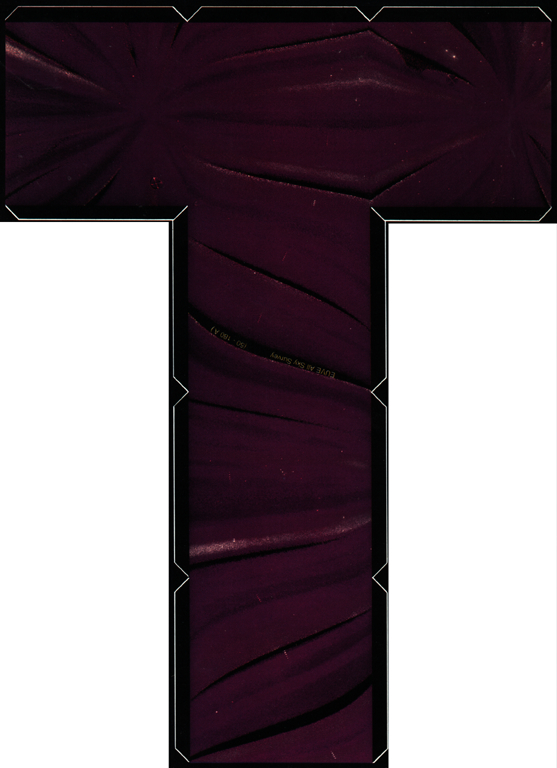
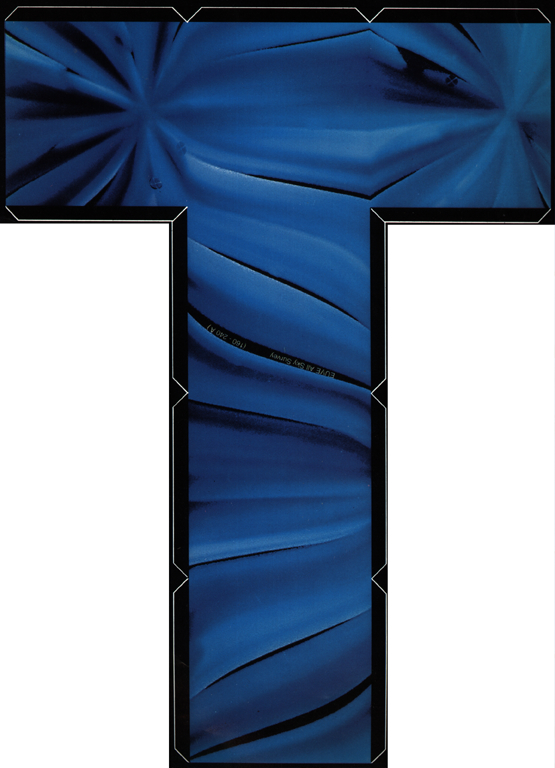
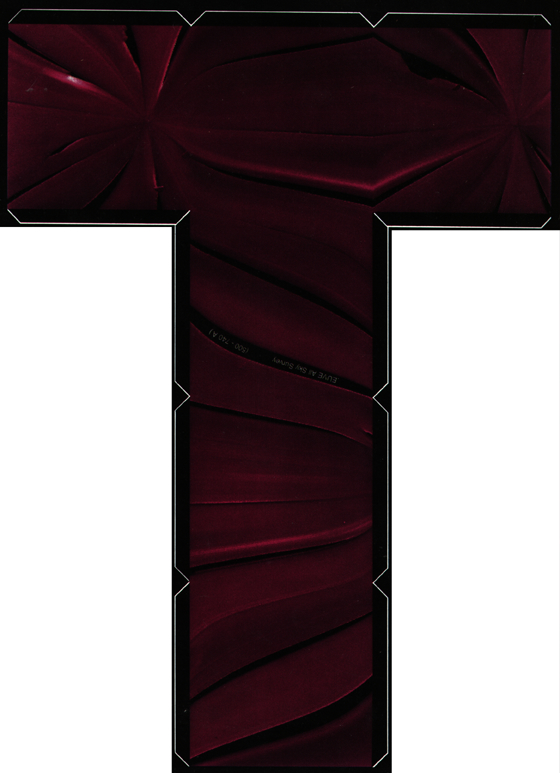
Student InformationInstructions:1. Read background material on the EUVE All-Sky Survey (below). 2. Make a color printout of the four maps below. 3. Cut out maps, fold into square segments as indicated by notches, and glue accordingly. 4. Look for each of the cellestial objects mentioned below and compare their representations on each cube. Background NASA's Extreme Ultraviolet Explorer (EUVE) launced on June 7, 1992, from the Kennedy Space Center, Florida. A major goal of the mission, to perform an all-sky survey in the extreme ultraviolet regin, was carried out between July 1992 and January 1993. Three grazing-incidence scanning telescopes perfomred the survey in four bandpasses (each represented by one of these color skymaps), with peak wavelengths at 80, 170, 400, and 550 angstroms (A). Gaps in the data (blank streaks) result from periods when the survey was stopped for calibration of instruments, and the disks represent instrument pointings. Gaps were filled in over the remainder of 1993, and completed maps were produced. (These, however, are not available as cutouts.) Approximately 250 objects were initially published in the EUVE Bright Source List and in recent years the total source list has exceeded 1000 objects. The completed cubes (available below) represent the three-dimensional EUV sky. The moon appears as a series of sources in a line. The Sky Maps Skymap for the Dagwood filter (composed of aluminum, titanium and antimony; peaks at 400 A). The hot white dwarf G191-B2B appears near the left edge of the cross of the T. Skymap for the Lexan filter (composed of Lexan and boron; peaks at 80 A). The Vela and Cygnus supernova remnants appear in the cross of the map's T shape. Skymap for the aluminum filter (composed of aluminum, carbon and titanium; peaks at 170 A). The hot white dwarf HZ43 appears near the base of the T. Skymap for the tin filter (composed of tin and silicon monoxide; peaks as 550 A). The B star Cais Majoris appears near the left edge of the base of the T. |
|
| |