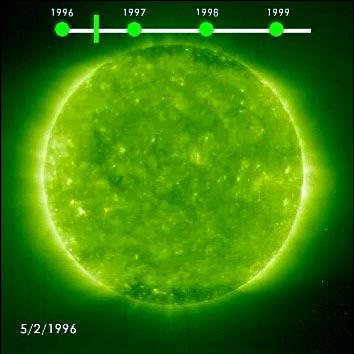
This movie demonstrates the increase in solar activity from 1996-99. The images we're taken by the SOHO spacecraft.
(Click
to launch movie) |
|
|
| |
In the mid-1800s astronomers discovered from thousands of sunspot sightings that, when they tabulated and graphed them, their numbers increased and decreased over time in a repeatable cycle. These extremes represent the amplitude of the cycle. We now call this the solar activity cycle or the sunspot cycle.
Solar Maxium (and minimum)
During the last 200 years, the time between years of maximum activity, which is called the period of the cycle, has been about 11 years, but sunspot cycles can be as short as 9 or as long as 15 years. During sunspot minimum conditions, such as the year 1996, astronomers counted fewer than 5 sunspots on the surface of the Sun at any one time. During sunspot maximum conditions in 2000, as many as 246 sunspots could be seen. On March 31, 2001, one very large sunspot group was visible to the naked eye with the proper safety precautions. (You should never look directly at the Sun without proper shielding to avoid eye damage!).
Variations in the Cycle
Ancient Chinese astronomers also kept track of naked-eye sunspots 4000 years ago, and that's how we know that sunspots have been a common feature of the Sun for millennia. We also know from graphs of the sunspot cycle that sometimes the Sun just stops making them altogether. This happened in the 1600s, and this was also the time when Europe was in the grip of what they called a mini-Ice Age.
The Solar Cycle and Weather
Scientists don't fully understand the connection between the sunspot cycle and weather conditions here on Earth, but there does seem to be something going on between them. Scientists have detected correlations between the ups and downs of the solar activity cycle and the behavior of a number of terrestrial atmospheric and climate systems. For example, the ozone hole over Antarctica has an area that appears slightly larger during sunspot maximum than sunspot minimum. Traces of the 11-year cycle have also been claimed to exist in ocean surface temperatures, coral reef layering and the sizes of northern hemisphere storm systems.
Text adapted from the Sun-Earth Connection Tutorial courtesy
of NASA, originally written by
Dr. Sten Odenwald. Images and
videos courtesy of NASA unless otherwised noted.
Page 3 of 10 |
|
 |
|
 |
|
Visit other pages in this section that focus on aspects of the Sun-Earth Connection.
|
|
 |
|
|