The
Reuvan Ramaty High Energy Solar Spectroscopic Imager, RHESSI,
will study the active Sun and energetic solar flares.
A flare results from the rapid release of magnetic energy
which has built up in the solar atmosphere. Flares are seen
as intense brightenings in active regions on the Sun. The
amount of energy released in a flare can be ten million times
greater than the energy released in a volcanic eruption. This
energy is released in a very short time—as little as
a few tenths of a second.
In this activity we will investigate one of the fastest and
most energetic events on the Sun, a solar flare. During a
flare, the Sun releases a large amount of energy in a short
period of time. Scientists observe solar flares in many different
wavelengths, from low-energy radio waves to high-energy gamma
rays. The RHESSI satellite will make much sharper pictures
of solar flares in high-energy X-rays and gamma rays than
any satellite to date. This activity uses X-ray flare data
from GOES, a Geostationary Operational Environmental Satellite,
since RHESSI has not yet collected data. GOES satellites primarily
monitor environmental conditions on Earth, but there is an
X-ray monitor on board which records X-ray emissions from
the Sun.
Scientists use a series of letters and numbers to classify
the energy level of an X-ray flare. The letters used are A,
B, C, M and X, with A being the weakest and X being the strongest.
This activity singles out M class flares because they occur
fairly often and are always strong enough to show up above
the normal X-ray emission level of the Sun.
The list below indicates the total number of X-ray flares
observed from the Sun in a given year. The total number of
M class flares, or high-intensity flares, is also listed.
For each year, calculate the percentage of M class flares
by dividing the number of M class flares by the total number
of flares and multiplying by 100. Fill in column 4 with your
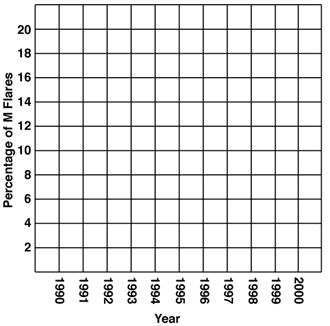
results. Use the graph below to plot the percentage of M class
flares over time. If you choose, you could also plot the total
number of flares, or the number of M class flares.
|
Year
|
Total Number
of Flares
|
Number
of M Flares
|
Percentage of
M Flares
|
|
1990
|
2630
|
273
|
|
|
1991
|
3324
|
590
|
|
|
1992
|
2815
|
202
|
|
|
1993
|
2446
|
74
|
|
|
1994
|
1610
|
25
|
|
|
1995
|
1124
|
11
|
|
|
1996
|
515
|
4
|
|
|
1997
|
1141
|
21
|
|
|
1998
|
2248
|
94
|
|
|
1999
|
2425
|
170
|
|
|
2000
|
2661
|
215
|
|
Fill in the values in column 4
for Percentage of M Flares and plot a graph.

Use the graph above to plot
the percentage of M Flares over time.
What do you notice from your graph?
You should see that the percentage of high-energy flares
from the Sun is not constant in time. This is also true
of the total number of flares, and the number of M class
flares. You should see a maximum percentage of M class flares
in 1991 and a minimum percentage in 1996. If you were to
extend this graph for a much longer period of time, you
would discover that the rise and fall occurs in a regular
cycle that repeats itself approximately every eleven years.
However, the maxima that occur every eleven years are not
always the same height.
Scientists also see this eleven-year activity pattern in
the number of sunspots on the Sun, and solar flares are
known to originate in regions where there are sunspots.
In general, the Sun goes through a regular activity cycle
with eleven years from one maximum (or minimum) to the next.
The last solar maximum occurred in the year 2000, and the
last solar minimum was in 1996. This pattern should be visible
in your graph. Can you predict when the next solar maximum,
or solar minimum, will be?
In the full version of this activity, X-ray Candles: Solar
Flares on Your Birthday, students count the number of high-intensity
X-ray flares in their birth month and combine their findings
with the rest of the class to obtain and graph complete
flare counts for each year.
 A
full
activity that investigates solar x-ray flares can be
found at the RHESSI Web site.
(Requires an Internet connection)
 An interactive
web activity
about
the correlation between sunspots and flares can be found
on the SEGway
Web site.
(Requires an
Internet connection)
 Learn more about the mission
at the RHESSI Web site.
(Requires an Internet connection)
|