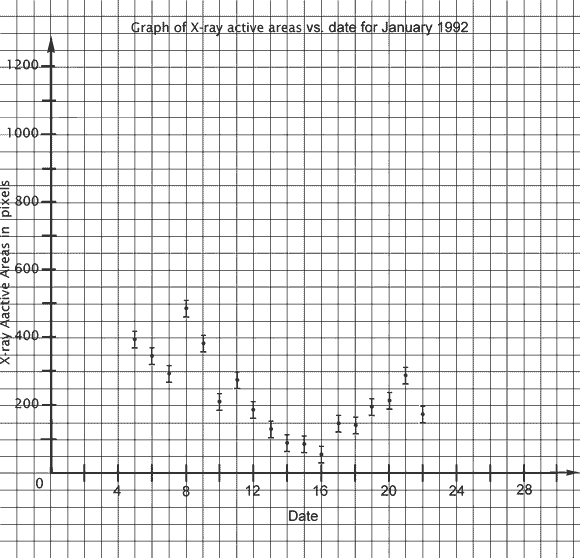
Sample Graph: X-ray Area vs. Time, from data table in Activity, page 3.

© 2000 Regents of the University of California
SUNSPOTS Lesson Resource Guide
|
Sample Graph: X-ray Area vs. Time, from data table in Activity, page 3.
© 2000 Regents of the University of California |