|
|
|||||
|
Measure Image Areas |
|
||||
Where am I now? This is your solar science "laboratory." This section includes the Java applet program you will use to measure areas on the solar images, instructions for using the program, and information you may need about the images. You can always return to another part of the site for review by using the navigation bar at the top. |
|||||
|
|||||
Painting = measuring Your goal is to test the hypothesis that there is a relationship between areas of sunspot activity and areas of x-ray activity. To look for a relationship, you must measure the areas. This is what you are doing by paining the images. The program produces a number for each area you paint: the area in pixels. Each pixel, by the way, is about the size of the earth! |
|||||
|
To launch the Java program please click the button below. (You'll need a java-compatible browser, we recommend Netscape 4.0 or higher)
|
|||||


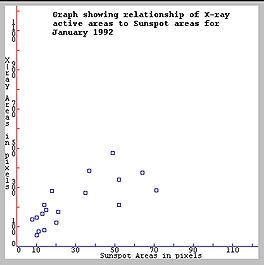
You will compare the sunspot and x-ray areas on a graph with sunspot areas on the horizontal axis, and x-ray areas on the vertical axis. The program will plot the points for you, or you may want to plot them for yourself. Use the button marked "plot" to see a display like the one at right. The program puts a point on the graph for each day's pair of images, where a line up from the horizontal axis at the value for the sunspot area meets a line over from the vertical axis at the height of the x-ray area. The points will not be positioned in time order because time is not one of the axes on the graph. Compare some point locations on your own graph to the "values" list to check this out. |
|||
Why a graph? The heart of your science is in how you interpret the resulting graph. Scientists make graphs because they show relationships immediately and visually. By looking at the graphs of these areas, you might be able to make some guesses about whether the sunspots and x-ray areas are related. Try to determine whether the graph shows a simple relationship, sometimes called a correlation, between the two quantities. Will the points look like they fall near a line or a smooth curve? This is how scientists find a correlation: plot the two quantities and hope that something simple and obvious shows up! (Science involves a certain amount of hoping and praying.) You could try to compare the two columns of numbers, but we think you'll find that looking for a line or simple curve on a plot of sunspot area vs. x-ray area is an easier way to see a relationship exists between the two quantities. To scientists, one graph can be worth a thousand numbers. Will you agree? What will you discover? Write down your analysis of the data, and compare your conclusions with others. |
|||
|
|
|||||
|
|
|||||
|
©Copyright 2001 Regents of the University of California. |