| The JAVA applet program (open it from the button on the previous page) is a tool to help you get
some data quickly and put it into a graphic form that is easy to analyse. Follow these steps to use the program. |
| |
|
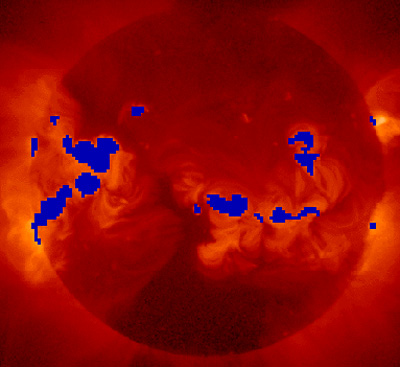
1. Prepare: Take some time to look at some of the
images and read about them in ABOUT THE IMAGES. There will be a white light image and an x-ray image for each of 28 days. Locate the images you will
use as soon as you have launched the program.
Decide what parts of the images are sunspots and x-ray active regions, using ACTIVE REGIONS
as a guide.
Remember, the quality of the science you do depends on whether:
- you know what you are measuring
- you collect your data carefully
- how fully you can understand and interpret the resulting graph
|
|
|
| |
|
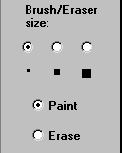
2. Paint and Record:
- Select "paint" mode and a brush size.
- Use the mouse to click on a part of the image you want to paint
- OR hold the button down and move to cover more area.
- Each pixel you paint is counted only once, no matter how many times the cursor touches it.
- You can erase anything while working on an image, by selecting "erase" mode. If it
suddenly seems the applet won't paint, check to see if you are still in erase mode.
- When you are done, write down the number of pixels painted in case you want to reload the image
later.
- Do this for each pair of images you are measuring.
You cannot go back to adjust the painted area once you load any other image, but you can do it
over by re-loading the image.
|
|
|
| |
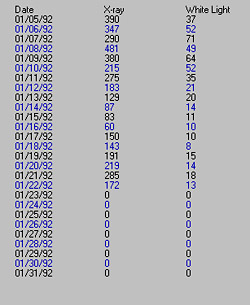 |
3. Data table:
Your areas will also be recorded automatically in a table, as pairs of numbers. Both visible and
x-ray images for each day appear on a single line. Each pair of numbers will become a point on a plot. You can
see the data points in a table at any time by pressing the button marked "values." |
|
| |
4. 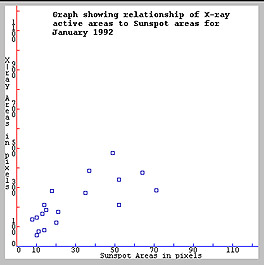 Plotting with the program Plotting with the program
When you have several pairs of measurements, you can create a graph of the points by pressing the "plot"
button. Your data points will appear on a graph with sunspot areas on the horizontal axis and x-ray areas on the
vertical axis.
Each day's pair of images, makes a small box on the graph. Its center is at the place where a line up from the
horizontal axis at the value for the sunspot area meets a line over from the vertical axis at the height of the
x-ray area. You may not see as many points as you think you should. Check your values --are they within the limits
of the plot axes (0-1200 for x-ray areas and 0-120 for sunspots)?? |
| |
| 5. Note that once you have either the table or the
plot displayed in the window, you can measure more images by loading a new image. However: if you reload
an image you have already painted, the old data will be lost and you will have to completely re-do it. |