|
SUNSPOTS Lesson Resource Guide Solar Scientist: |
|
|
Date: |
|
Sunspots Data Graph

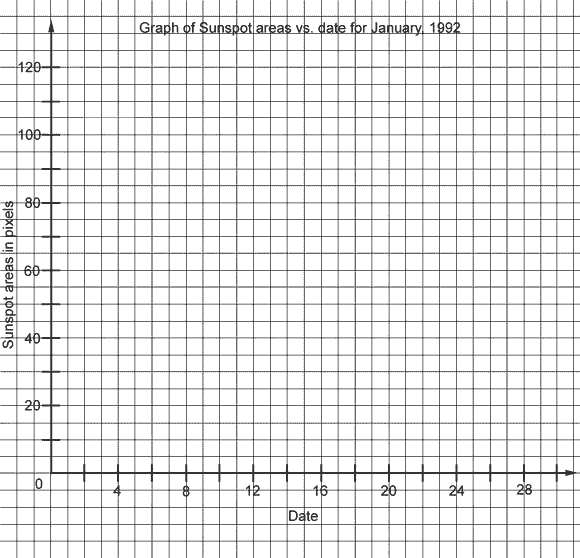
Study the change in sunspot areas over time by plotting them on a graph, with sunspot areas on the vertical axis, and date on the horizontal axis. Put a point on the graph for each day's white light image, where a line up from the date axis at the value for the day meets a line over from the sunspot area axis at the height of the sunspot area. You can also make a bar graph, by drawing a bar centered on the date, reaching the height of the measured sunspot area, for each daily image.
Student Worksheet
© 2000 Regents of the University of California